
It is the end of the month. Sales look strong, the income statement shows a profit, and yet the bank balance feels uncomfortably low. Someone asks why, and the answer is often scattered across invoices, inventory reports, payroll files, and a spreadsheet no one fully trusts.
This is not necessarily a sign that the business is failing. It is often a sign that its information is disconnected. Revenue, profit, cash flow, and working capital describe different parts of the same commercial story, but they are frequently reviewed in isolation.
A simple management report brings those parts together. It does not need complex dashboards or expensive software. It needs a consistent structure, a few well-defined measures, and a habit of explaining the movement from one number to the next.
For students, this is a practical bridge between accounting concepts and business decisions. For working professionals, it is a way to turn monthly accounts into information managers can actually use.
🧭 Start with the purpose of the report
A management report is an internal decision-making document. Unlike statutory financial statements, which are prepared for external users and follow formal reporting requirements, a management report should answer the questions the business needs answered now.
Typical questions include: Are sales growing? Is growth profitable? Why did cash change? Are customers paying on time? Is too much cash tied up in stock? Define the questions before building the layout; otherwise, the report becomes a collection of numbers without a decision behind it.
🔗 Understand the four connected measures
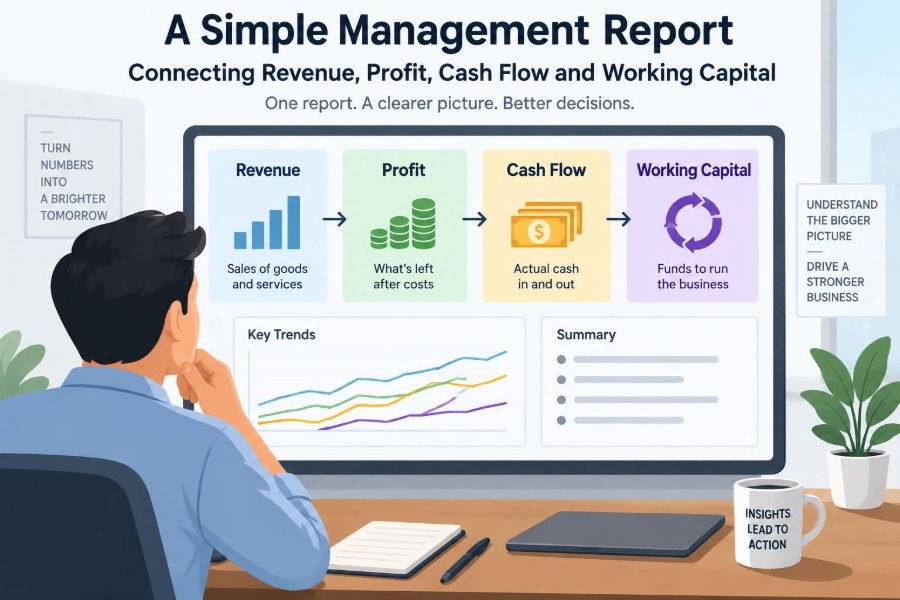
The report should connect revenue, profit, cash flow, and working capital. Revenue is income earned from sales. Profit is what remains after matching revenue with the costs incurred to generate it. Cash flow tracks actual cash received and paid. Working capital describes short-term operating assets and liabilities.
They move together, but not at the same time. A sale on credit can increase revenue and profit today, while its cash is not received until a later period. That timing difference is the reason a management report needs all four views.
📈 Define revenue before trying to explain it
Revenue should reflect the value of goods or services earned during the reporting period, after relevant discounts, returns, and adjustments. The precise policy depends on the business model, but consistency matters more than a visually impressive number.
Break revenue into useful categories: product line, customer group, location, sales channel, or recurring versus one-off work. A total revenue figure may show growth, while a category view reveals that a high-margin service is shrinking beneath growth in a lower-margin product.
🧮 Move from revenue to gross profit
Gross profit is revenue less the direct cost of supplying the goods or services sold. In a retailer, this commonly includes the cost of inventory sold. In a service business, it may include directly attributable staff time, subcontractors, or project materials.
The gross profit calculation is simple, but classification requires judgement. If direct costs are buried in general overhead, gross margin will look stronger than it truly is. Apply a documented, sensible approach and use it consistently from month to month.
📊 Use margin to make revenue comparable
Revenue is measured in currency; margin translates performance into a proportion. Gross margin is calculated as gross profit divided by revenue. It helps managers compare periods, products, and customer groups of different sizes.
For example, a hypothetical business may grow sales from $100,000 to $120,000, but see gross profit rise only from $40,000 to $42,000. Revenue improved by $20,000, while the additional sales produced just $2,000 of gross profit. The report should prompt a question about pricing, discounts, input costs, or product mix.
🏢 Continue from gross profit to operating profit
Operating profit deducts operating expenses such as rent, administration, sales salaries, software, marketing, and depreciation from gross profit. It shows whether the core operation generates a surplus before financing and certain non-operating items, depending on the reporting convention used.
A useful report separates variable costs, which tend to change with activity, from more fixed costs, which do not immediately move with sales. That distinction helps management see whether revenue growth is covering the additional cost of running the business.
🧾 Keep non-cash expenses visible
Some expenses reduce accounting profit without causing a cash payment in the same month. Depreciation is the common example: it allocates the cost of a long-lived asset over its useful life rather than recording the full cost as an immediate expense.
Do not remove these costs from profit simply because they are non-cash. They represent the consumption of assets used by the business. Instead, show them clearly so readers understand one reason profit and operating cash flow differ.
💵 Treat cash as a separate measurement
Cash flow is not an alternative name for profit. It measures cash actually moving through bank accounts and petty cash. A profitable company can have weak cash flow when customers pay slowly, inventory builds up, or suppliers must be paid before sales are collected.
Conversely, cash can temporarily look strong when a business delays supplier payments or collects customer deposits. Neither situation is fully explained by a bank balance alone. The report needs a cash bridge.
🌉 Build a simple cash bridge
A cash bridge explains the movement from opening cash to closing cash. Begin with the opening bank balance, list the major operating, investing, and financing movements, and arrive at the closing balance that agrees to the bank record.
| Cash movement category | Typical examples | Management question |
|---|---|---|
| Operating cash | Customer receipts, supplier payments, payroll | Is normal trading generating cash? |
| Investing cash | Equipment purchases, asset disposals | What is being invested for future capacity? |
| Financing cash | Loans, repayments, owner contributions, dividends | How is the business funded? |
For a small business, a direct cash view based on actual receipts and payments is often easiest to understand. Larger organisations may also reconcile profit to operating cash flow using adjustments for non-cash items and working-capital movements.
🧱 Define working capital in plain language
Working capital is usually current operating assets less current operating liabilities. In practical management reporting, the main components are trade receivables, inventory, trade payables, and sometimes accrued expenses or customer deposits.
It represents cash tied up in the operating cycle. A business buys or produces goods, sells them, waits for collection, and pays suppliers according to agreed terms. The speed and balance of that cycle can have a major effect on liquidity.
👥 Track receivables as unpaid sales
Trade receivables are amounts customers owe after goods or services have been supplied. When receivables rise, it may mean sales are growing, but it may also mean collection is slowing. The two explanations have very different cash implications.
Include total receivables, overdue balances, and a short ageing analysis in the report. An ageing analysis groups debts by how long they have been outstanding. It turns “customers owe us money” into a focused list for follow-up.
📦 See inventory as cash on shelves
Inventory supports customer service and sales, but it is also cash that cannot be used elsewhere until stock is sold. Rising inventory may be intentional before a seasonal peak, or it may signal weak demand, poor purchasing discipline, obsolete items, or inaccurate records.
Do not judge inventory only by its total value. Compare it with sales trends, expected demand, stock ageing, and gross margin. Slow-moving items can become a cash and profitability issue if they later require discounting or write-downs.
🤝 Interpret payables with balance
Trade payables are amounts owed to suppliers. Increasing payables can preserve cash in the short term, but it is not automatically positive. It may reflect normal credit terms, an agreed payment plan, or pressure caused by insufficient cash.
Show payables by due date and identify any material overdue amounts. Paying too quickly can strain cash; paying too slowly can damage supplier relationships, interrupt supply, or cause the business to lose useful credit terms.
⏱️ Use days metrics carefully
Days measures help make working capital easier to compare. Receivable days estimate how long customers take to pay. Inventory days estimate how long stock is held. Payable days estimate how long the business takes to pay suppliers.
These are indicators, not exact stopwatches. A common calculation uses an ending balance divided by a relevant annualised or period cost or revenue figure, multiplied by days. Seasonal businesses and rapidly changing sales patterns can make a single month-end ratio misleading.
🔄 Explain the cash conversion cycle
The cash conversion cycle brings the operating cycle together: inventory days plus receivable days, less payable days. In broad terms, it estimates how long cash is committed between paying for inputs and collecting from customers.
A shorter cycle generally reduces funding pressure, but “shorter” is not always better. Very low inventory can lead to lost sales, and aggressive collection or payment practices can harm relationships. Use the measure to understand trade-offs, not to chase a number blindly.
🗓️ Choose a reporting period and comparison base
Monthly reporting is common because it is frequent enough to spot changes while allowing time to close the accounting records. A report should normally show the current month, year-to-date performance, a budget or forecast comparison, and an appropriate prior-period comparison.
Comparisons need context. A seasonal retailer should not interpret December using only November as a benchmark. Comparing with the same month last year, alongside forecast, may provide a more useful perspective.
🎯 Include budget, forecast, and actual results
Actual results show what happened. A budget is a planned baseline, usually set before the period. A forecast is an updated view of what management now expects. These terms are often mixed up, which creates confusion in review meetings.
Use each for its proper purpose. Budget variance asks whether performance followed the original plan. Forecast variance asks whether the latest expected outcome is changing. A management report becomes more useful when it distinguishes past performance from future expectation.
🔎 Focus commentary on material variances
Not every small difference needs an explanation. Set practical thresholds based on the size and risk profile of the business, then comment on the movements that could affect decisions, cash availability, or future performance.
Strong commentary follows a simple pattern: what changed, why it changed, what it means, and what happens next. “Revenue was below budget because a planned customer launch moved into next month; the cash effect is expected to follow the revised delivery date” is more useful than “revenue unfavorable.”
🧠 Separate fact, estimate, and assumption
Management reporting often includes estimates: accrued costs, expected credit losses, inventory provisions, and forecasts. These are necessary, but readers should know which figures are final records and which are management judgements.
Label significant assumptions plainly. If a cash forecast assumes a large customer will pay by a certain date, state that assumption and consider showing the consequence if payment is delayed. Transparency is more valuable than false precision.
🧩 Design a one-page core dashboard
A concise first page helps busy readers see the position before they reach supporting detail. It should contain the essential measures, not every available measure. The detailed schedules can sit behind it for finance staff and operational owners.
- Revenue, gross profit, gross margin, and operating profit
- Opening cash, net cash movement, and closing cash
- Receivables, inventory, payables, and working capital
- Selected days measures and material variances
- Three to five explanations, decisions, or actions
A clean dashboard is not a substitute for accounting records. It is a navigational page that directs attention to the areas requiring action.
🧱 Use a consistent report structure
Readers should know where to find information every month. A reliable sequence is executive summary, profit and loss view, cash bridge, working-capital schedule, forecast, and actions or risks. Consistent order reduces the time spent decoding the report.
Keep definitions and calculation methods stable unless there is a sound reason to change them. When a method changes, disclose it in the report. Otherwise, an apparent performance movement may merely be a reporting change.
🛠️ Build from reliable source data
Start with the accounting ledger, bank reconciliations, sales records, payroll data, inventory system, and accounts receivable and payable schedules. Reconcile the major report totals to underlying records before spending time on charts or commentary.
A spreadsheet can be entirely appropriate for a simple report, provided formulas are controlled, inputs are traceable, and checks are built in. More sophisticated reporting software improves speed and automation, but it cannot correct poorly maintained source data.
✅ Add simple control checks
Small checks prevent large misunderstandings. Closing cash should agree to reconciled bank balances. Revenue by category should add to total revenue. Receivables and payables schedules should agree to the ledger. The working-capital movement should be plausible alongside the cash bridge.
Use visible exception flags rather than hiding checks in complex formulas. A report that identifies an unresolved difference is more trustworthy than one that appears polished while silently containing an error.
🗣️ Assign owners to actions, not just numbers
Finance may prepare the report, but commercial and operational managers often control the actions behind it. A receivables issue may belong to account managers, a stock issue to purchasing, and a margin issue to pricing or delivery teams.
Turn key findings into named actions with dates. For example: “Sales manager to confirm collection plan for invoices over agreed terms by Friday.” This changes reporting from retrospective explanation into a management tool.
🚧 Avoid the profit-is-cash mistake
The most common misunderstanding is treating profit as cash available to spend. Profit includes credit sales, accruals, depreciation, and other accounting adjustments. Cash availability depends on collection, payment timing, investment, borrowing, and distributions as well as trading performance.
Another error is celebrating sales growth without asking whether the growth absorbs working capital. A growing business can require additional financing precisely because it must fund more stock, more customer credit, and more operating activity before collections arrive.
⚠️ Avoid excessive detail and metric overload
A report can fail by being too long as easily as by being too short. Twenty measures with no prioritisation make it difficult to see the two measures that need immediate attention. Add a metric only when someone can reasonably act on it or use it to assess a risk.
Likewise, avoid colour-coded dashboards that imply certainty without explanation. A red indicator should lead to a clear cause, financial effect, owner, and response. Colour is a signal, not analysis.
🔄 Establish a monthly reporting rhythm
Set a realistic close timetable. Post routine transactions, reconcile cash, review cut-off and accruals, prepare schedules, validate the report, distribute it, and hold a short review meeting. The exact timing depends on the business, but reliability matters more than producing a rushed report immediately after month-end.
Keep a rolling list of recurring adjustments and known data issues. Each month should improve the next report, whether that means cleaner customer master data, faster expense coding, or a better explanation of an unusual cost.
🔮 Add a short cash forecast
Historical cash flow tells management what happened. A short-term cash forecast supports decisions before cash pressure appears. For many organisations, the most useful forecast looks several weeks or months ahead and focuses on expected receipts, payroll, supplier payments, tax obligations, debt service, and major investments.
Forecasts are uncertain by nature. Use best estimates, update them frequently, and focus attention on the largest or least certain flows. A range of plausible outcomes can be more honest and useful than a single precise-looking closing balance.
🧪 Test scenarios when the position is tight
Scenario analysis asks “what if?” without claiming that one outcome will occur. A simple cash scenario might test a delayed customer payment, lower sales volume, higher purchase costs, or an unexpected equipment repair.
Use a small number of meaningful scenarios. The point is not to model every possibility; it is to identify which assumptions most affect liquidity and what action could reduce the risk, such as accelerating collections, deferring discretionary spending, or arranging funding early.
👶 Scale the report to the business
A small service firm may need a compact report covering sales, payroll, receivables, bank cash, and a rolling cash forecast. A manufacturer may need deeper analysis of inventory, production costs, purchase commitments, and customer concentration.
There is no universal template. The right design reflects the business model, its funding position, its operational risks, and who will use the report. Start simple, then add detail only where repeated decisions require it.
🧭 Bring the story together
The central discipline is to explain the chain of events. Revenue creates the possibility of profit. Profit shows whether activity created value after costs. Working capital explains how much of that value remains tied up in day-to-day operations. Cash flow shows what reached, or left, the bank.
When the report presents that chain consistently, management can distinguish a timing issue from a margin problem, a growth opportunity from a funding requirement, and a temporary cash dip from a deeper operating weakness. That is the real value of management reporting.
A useful management report does not merely display revenue, profit, cash, and working capital; it explains how each one affects the others and what the business should do next. With a sound structure and disciplined review, even a simple monthly report can support clearer decisions. 📊💵🧭