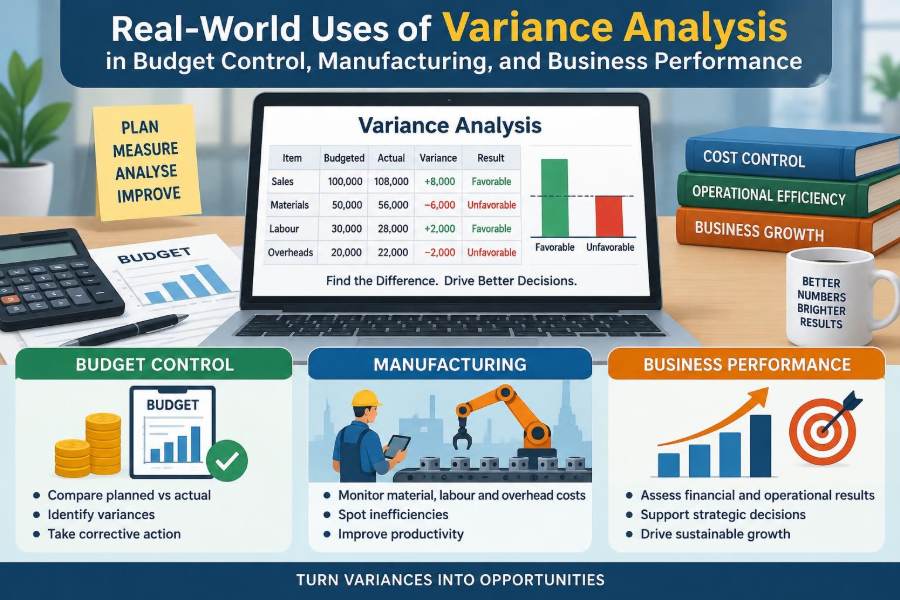

It is the final week of the month, and a manager sees that operating costs are above budget. The immediate question is usually simple: “What went wrong?” The useful answer is rarely simple.
Maybe sales were lower than planned, so fixed costs were spread across fewer units. Maybe a supplier increased prices. Maybe a production team used more material because a new batch had a higher defect rate. Or perhaps the budget itself was based on assumptions that no longer fit reality.
This is where variance analysis becomes practical rather than theoretical. It gives managers a structured way to compare plans with results, separate different causes, and decide what deserves attention.
Used well, variance analysis is not a search for someone to blame. It is an early-warning and learning system for controlling budgets, improving operations, and making better business decisions.
📊 What Variance Analysis Actually Measures
Variance analysis is the process of comparing an expected amount with an actual result and investigating the difference. The expected amount may come from a budget, standard cost, forecast, target, or prior plan.
A variance can relate to money, units, hours, rates, or performance measures. For example, actual material spending may differ from the budget, actual labor hours may differ from the standard allowed, or actual sales volume may differ from the forecast.
The basic calculation is straightforward:
Variance = Actual result − Planned or standard result
The value comes from interpreting that number correctly. A difference alone does not explain whether performance changed because of price, volume, efficiency, timing, quality, or an unrealistic plan.
🧭 Why a Single Difference Is Not an Explanation
Suppose a factory spent more on direct materials than budgeted. Calling this an “unfavorable material variance” identifies a problem area, but not its cause.
The factory may have paid more per kilogram, consumed more kilograms per finished unit, produced more units than originally planned, or experienced all three effects at once. Each cause calls for a different response.
Variance analysis works best when it moves from a broad question—why did the total differ?—to specific, controllable explanations. That prevents managers from making decisions based on a misleading headline number.
⚖️ Favorable and Unfavorable Depend on the Measure
A favorable variance improves the relevant financial or operating objective. An unfavorable variance worsens it. For costs, spending less than planned is usually favorable; for revenue, earning more than planned is usually favorable.
However, these labels are not final judgments. A favorable labor-cost variance could result from using fewer skilled employees, but it may also be linked to lower quality, rework, delayed deliveries, or employee burnout.
Similarly, an unfavorable maintenance variance may be sensible if planned preventive maintenance avoids expensive equipment failures later. Managers should treat favorable and unfavorable labels as prompts for inquiry, not verdicts.
🎯 The Budget as a Working Expectation
A budget is a financial expression of a plan. It converts expected activity—such as units produced, customers served, staff hours, or projects delivered—into expected revenue, costs, and cash needs.
Variance analysis tests whether that plan is unfolding as expected. This makes it central to budget control: managers compare actual outcomes with budgeted expectations, investigate meaningful gaps, and update decisions before the period ends.
A budget should not be treated as a fixed description of reality. Markets shift, supply chains change, and customer demand moves. The budget remains useful when managers distinguish a changed environment from weak execution.
🔄 Static Budgets and Flexible Budgets
A static budget is prepared for one planned activity level. It can be useful for overall planning, but it becomes less informative when actual volume differs significantly from the original plan.
A flexible budget adjusts variable costs and revenues to the actual level of activity. Fixed costs generally remain unchanged within the relevant range, while variable items change with output, hours, sales, or another cost driver.
For example, if a café budgets ingredients for 10,000 drinks but sells 12,000, comparing actual ingredient cost with the original budget unfairly treats the extra volume as overspending. A flexible budget estimates what ingredients should have cost for 12,000 drinks, making operational performance easier to assess.
🧮 A Simple Flexible-Budget Example
Imagine a manufacturer planned to produce 1,000 units. Standard material use is 3 kilograms per unit at a standard price of $4 per kilogram. The original material budget is therefore $12,000.
Actual production is 1,200 units. At that volume, the flexible material budget is 1,200 × 3 × $4, or $14,400. If actual material cost is $15,000, the meaningful spending variance is $600 unfavorable—not $3,000 unfavorable compared with the static budget.
This example shows why volume must be separated from cost control. Producing more can increase total spending while still reflecting efficient operations.
🏭 Standard Costs in Manufacturing
Manufacturers often use standard costs: predetermined expected costs for material, labor, and overhead required to make one unit. Standards provide a consistent benchmark for valuing inventory, planning costs, and evaluating production performance.
A good standard is based on realistic conditions. It may reflect expected supplier prices, normal waste, normal machine downtime, expected labor skill, and practical production methods.
If standards are never updated, variances become noisy. If standards are too easy, they hide inefficiency. If they are unrealistically tight, employees may view every variance report as unfair and ignore it.
🧱 Direct Material Price Variance
The direct material price variance isolates the effect of paying a different price from the standard price. It is commonly calculated as:
Material price variance = Actual quantity purchased × (Actual price − Standard price)
An unfavorable price variance can arise from supplier price increases, lost purchasing discounts, rush orders, currency movements, small order quantities, or buying a higher-grade material. A favorable result might arise from negotiation, bulk purchasing, or a lower-priced substitute.
Purchasing staff often influence this variance, but they should not be assessed in isolation. A cheaper input that increases scrap or customer returns may save money at purchase while raising total business cost.
🧪 Direct Material Usage Variance
The material usage, or quantity, variance measures whether production consumed more or less material than the standard quantity allowed for actual output.
Material usage variance = Standard price × (Actual quantity used − Standard quantity allowed)
Common causes include waste, spoilage, design changes, poor-quality inputs, inaccurate cutting, machine calibration problems, theft, or unusually skilled handling. The production department may influence many of these causes, but purchasing decisions can also matter when input quality changes.
Looking at price and usage together helps prevent a common mistake: celebrating a lower purchase price when it is followed by much higher material consumption.
👷 Direct Labor Rate Variance
The labor rate variance compares the actual hourly pay rate with the standard hourly rate. It may reflect wage agreements, overtime premiums, staffing mix, incentive payments, or the use of temporary workers.
Labor rate variance = Actual hours worked × (Actual hourly rate − Standard hourly rate)
An unfavorable rate variance is not necessarily poor performance. A company may deliberately use more experienced employees to resolve a complex production problem, meet a critical deadline, or maintain safety and quality requirements.
Managers should ask whether the higher hourly cost generated a compensating benefit in speed, output quality, reliability, or customer service.
⏱️ Direct Labor Efficiency Variance
The labor efficiency variance measures whether employees used more or fewer hours than the standard hours allowed for actual production.
Labor efficiency variance = Standard rate × (Actual hours − Standard hours allowed)
Extra hours may arise from weak training, equipment downtime, poor scheduling, product complexity, rework, material shortages, or an inexperienced team. Fewer hours may reflect process improvement, better workflow, automation, or a simpler product mix.
Labor efficiency should be interpreted alongside quality. Finishing work quickly is not efficient if defects create warranty claims or require expensive rework later.
⚙️ Understanding Variable Overhead Variances
Variable overhead includes indirect production costs that tend to change with activity, such as indirect materials, some utilities, and certain support supplies. These costs are usually assigned using a driver such as direct labor hours or machine hours.
A spending variance compares actual variable overhead with the amount expected for actual activity. An efficiency variance considers whether the activity driver was used efficiently.
For instance, a machine-intensive plant may see an unfavorable variable-overhead efficiency variance when machines run longer than standard. The cause may be slow setup times, breakdowns, or lower production speed rather than excessive utility prices.
🏗️ Fixed Overhead Requires Different Thinking
Fixed manufacturing overhead includes costs such as factory rent, salaried supervision, insurance, and depreciation that generally do not change immediately with production volume. Because these costs behave differently, their variances need different interpretation.
A fixed-overhead spending variance compares actual fixed overhead with the budgeted amount. It can identify unexpected repairs, unplanned salary costs, or rent and service-cost changes.
A production-volume variance reflects the effect of producing at a different level from the level used to set the overhead rate. It does not automatically indicate overspending; it often shows that fixed capacity was underused or overused.
📉 Capacity Utilization and the Cost of Idle Resources
A plant can control spending tightly and still have weak financial performance if expensive capacity is unused. When output is below the normal level used to absorb fixed overhead, each unit carries a larger share of fixed costs.
Low utilization may result from weak demand, supply shortages, maintenance shutdowns, labor constraints, scheduling issues, or a deliberate choice to retain capacity for future demand. The appropriate solution depends on which cause is present.
Cutting fixed costs may help in some circumstances, but it can also reduce the ability to respond when demand returns. Capacity variances should therefore connect operations with sales forecasts and longer-term strategy.
🛒 Sales Price Variance in Commercial Teams
Variance analysis is not limited to costs. A sales price variance compares actual selling prices with planned or standard prices for the actual volume sold.
A lower average selling price may be caused by discounts, promotions, competitive pressure, contract terms, customer mix, or sales of lower-priced products. A higher price may result from improved product mix, successful value-based pricing, or fewer discounts.
Price changes should be considered with volume and margin. A discount that reduces unit margin may still increase total contribution if it creates enough additional profitable sales, but that outcome must be measured rather than assumed.
📦 Sales Volume Variance and Demand Signals
A sales volume variance measures the financial effect of selling a different quantity than planned. It may be analyzed using revenue, contribution margin, or budgeted profit, depending on the decision context.
Volume differences can reveal changing customer demand, missed sales opportunities, stockouts, competitor actions, service failures, or forecast weaknesses. A strong volume result may also strain operations if the organization lacks staff, inventory, or delivery capacity.
Sales teams should not be judged only on revenue volume. Selling a high volume of low-margin products can look successful in revenue reports while weakening profitability.
🧩 Product Mix Can Change the Meaning of Results
Many businesses sell more than one product or service. A total sales target may be achieved while profit falls if customers buy a larger proportion of low-margin offerings.
This is a sales mix issue. Product mix variance examines the effect of selling a different combination of products than planned, while sales quantity variance focuses on total volume.
Consider a retailer that sells both premium and entry-level models. A shift toward entry-level models may lift unit sales but reduce total gross margin. That is not necessarily bad—it may support market entry or inventory clearance—but leadership should recognize the trade-off.
🏢 Variance Analysis Beyond the Factory
Service organizations also use variance analysis, although their inputs may be labor time, customer appointments, project hours, service capacity, or digital usage rather than physical materials.
A consulting firm may compare actual project hours with budgeted hours. A hospital department may compare staffing hours with patient activity while considering acuity and safety. A software team may compare cloud-service spending with expected customer usage.
The principle remains the same: compare actual performance with a relevant expectation, then identify the operational driver behind the gap.
💵 Cash Flow Variances Protect Liquidity
Profit and cash are related but not identical. A profitable business can still face pressure if customer collections are slower than planned, inventory is purchased early, or large payments arrive sooner than expected.
Cash-flow variance analysis compares expected cash receipts and payments with actual timing and amounts. It helps finance teams identify collection delays, unexpected payment needs, changes in supplier terms, and possible financing requirements.
For a growing business, this analysis can be especially useful. Higher sales may consume cash when inventory, payroll, and delivery costs must be paid before customers settle invoices.
🗓️ Timing Differences Versus Permanent Changes
Not every variance represents a lasting performance issue. Some arise because an invoice was received early, a customer payment arrived late, a maintenance bill was booked in one month rather than another, or a seasonal purchase was made ahead of schedule.
Managers should distinguish timing variances from permanent changes in cost, demand, or efficiency. A timing issue may reverse next period; a structural issue may require a revised budget, process change, or commercial decision.
Reviewing trends across several periods is often more informative than reacting aggressively to one month’s result.
🔍 Materiality Helps Teams Focus
Investigating every small difference wastes time and encourages reporting fatigue. Organizations usually establish practical thresholds based on amount, percentage, risk, recurrence, and management relevance.
A small variance can still deserve investigation if it signals a control failure, safety concern, fraud risk, customer-impact issue, or emerging trend. Conversely, a large one-time variance may need explanation but not an ongoing corrective program.
Materiality is therefore a judgment tool, not merely a numerical cutoff. The question is whether investigating the variance could reasonably change a decision or prevent a meaningful problem.
🧑💼 Assign Responsibility Without Creating Blame
Responsibility accounting links financial outcomes to the managers or teams who can influence them. A purchasing manager may influence supplier prices, a production manager may influence material usage, and a sales manager may influence discounts and volume.
But influence is not the same as complete control. A production manager cannot prevent a market-wide raw-material shortage, and a buyer may be required to use a more expensive approved supplier for quality or regulatory reasons.
Constructive variance review asks: What happened? Why did it happen? Who has useful information? What action is appropriate? This approach produces better learning than using reports mainly to assign fault.
🧠 Root-Cause Analysis Turns Reports Into Action
A variance report identifies where to look; root-cause analysis identifies what to change. Teams may review transaction details, production records, supplier information, staffing patterns, customer feedback, and operational observations.
A useful sequence is:
- Confirm that the data and budget basis are accurate.
- Separate volume, price, rate, and efficiency effects where possible.
- Identify the operational event or decision behind each significant variance.
- Decide whether the cause is temporary, controllable, or likely to recur.
- Assign a specific action, owner, and review date.
For example, an unfavorable material usage variance may lead to equipment calibration, revised work instructions, supplier-quality testing, or a review of product design—not simply a reminder to “reduce waste.”
📈 Variance Reports Need Clear Visual Design
Managers need reports that make exceptions visible quickly. A useful report usually shows actual results, budget or flexible-budget results, the variance amount, the variance percentage where meaningful, and a brief explanation or action status.
| Measure | Budget Basis | Actual | Useful Follow-Up Question |
|---|---|---|---|
| Material cost | Flexible budget | Actual purchases and use | Price, usage, or production-volume effect? |
| Labor cost | Standard hours for output | Actual hours and rates | Rate, efficiency, training, or downtime issue? |
| Sales revenue | Sales forecast | Actual invoices | Price, volume, mix, or timing difference? |
| Operating cash | Cash forecast | Actual receipts and payments | Collection, inventory, or payment-timing issue? |
Too much detail can obscure the message. Good reports allow a manager to start with the exception, then drill into supporting detail when investigation is justified.
🤖 Technology Speeds Up Detection, Not Judgment
Accounting systems, enterprise resource planning systems, dashboards, and spreadsheets can automate comparisons and flag threshold breaches. This reduces manual effort and may allow more frequent review.
However, automation cannot decide whether a variance is economically sensible, whether data has been coded correctly, or whether a change in customer behavior is strategically positive. Those require context and professional judgment.
Before relying on automated alerts, organizations should define consistent data sources, ownership, cost drivers, and approval processes. Fast reporting based on weak data only delivers confusion faster.
🚩 Common Mistakes That Distort Variance Analysis
Several mistakes repeatedly reduce the value of variance analysis:
- Comparing actual results only with a static budget when activity changed substantially.
- Investigating totals without separating price, volume, and efficiency drivers.
- Using outdated standards that no longer reflect the operating environment.
- Treating favorable variances as automatically good and unfavorable ones as automatically bad.
- Ignoring quality, safety, customer experience, and long-term consequences.
- Waiting until year-end, when corrective action is less useful.
- Using reports as a performance weapon rather than a decision tool.
The shared problem is loss of context. A variance is a signal, not a complete explanation.
🛠️ Building a Practical Monthly Review Routine
A strong routine does not need to be complicated. First, close the period with reliable transaction data and reconcile major balances. Next, compare actual results with the right budget basis, including flexible budgets where activity levels changed.
Then rank exceptions by materiality and risk. Ask operational managers for explanations before conclusions are finalized, because accounting data often shows the effect of an event without showing the event itself.
Finally, document decisions: accept the variance, correct an operating issue, revise a forecast, update a standard, or escalate a risk. The following month, check whether the agreed action had the intended effect.
🔮 Forecasting Benefits From Variance Patterns
Budget control looks backward enough to understand what happened, but it should also look forward. Repeated variances can reveal that the remaining-period forecast needs revision.
If a supplier price increase is likely to continue, simply explaining the current price variance is not enough. Finance may need to revise expected margins, purchasing plans, pricing decisions, or cash needs.
Rolling forecasts are useful in uncertain environments because they replace outdated assumptions with current information. They do not eliminate uncertainty, but they make it more visible and actionable.
⚠️ When a Variance Is a Strategic Choice
Some variances are intentional. A company may spend above budget on training, product development, cybersecurity, customer retention, or preventative maintenance because it expects future benefits.
In these cases, the key question is not “Why did we overspend?” alone. It is “Was the additional spending authorized, aligned with strategy, and producing the expected operational evidence?”
Classifying purposeful investment separately from uncontrolled overspending helps managers preserve valuable initiatives while still maintaining financial discipline.
🌍 External Conditions Must Be Separated From Execution
Economic conditions, supply availability, exchange rates, weather disruptions, regulatory developments, and competitor behavior can all affect results. Managers should avoid attributing every unfavorable result to internal execution when external conditions played a major role.
At the same time, “external factors” should not end the discussion. The organization may still be able to respond through alternative sourcing, revised pricing, inventory policies, customer communication, or contingency planning.
The practical distinction is between a cause the business cannot control and a response it can control.
📚 What Students and Professionals Should Practice
For students, the formulas matter because they reveal the logic behind a total variance. Practice explaining each result in plain language: what changed, what might have caused it, and which manager or process could investigate further.
For working professionals, technical accuracy should be paired with operational curiosity. Speak with purchasing, production, sales, and service teams rather than interpreting every variance from a spreadsheet alone.
The strongest analysts connect financial information to physical and commercial reality: materials received, hours worked, machines used, customers served, invoices collected, and decisions made.
🏁 The Core Principle: Learn, Decide, Improve
Variance analysis is most useful when it creates a disciplined feedback loop. Plans establish expectations, actual results reveal departures, investigation identifies drivers, and management action improves the next decision.
Budget control, manufacturing cost management, sales performance, and cash planning all rely on this same logic. The calculations may differ, but the purpose is consistent: turn differences into understanding.
When reports are timely, standards are credible, and discussions focus on causes rather than blame, variance analysis becomes a practical management tool rather than a monthly accounting exercise.
The real value of variance analysis is not finding a number that differs from plan; it is using that difference to make a better next decision. 💰📊🔧