
A founder looks at a growing sales chart and assumes the business is close to making money. A manager sees a busy shop floor, packed appointments, or a full sales pipeline and reaches the same conclusion. Then the monthly accounts arrive, and the result is still a loss.
The missing question is not simply, “How much did we sell?” It is “How much did each sale contribute after its direct costs, and when will that contribution cover the costs that exist even if we sell nothing?”
A break-even model answers that question in a disciplined way. It converts prices, costs, volume, and timing assumptions into a visible threshold: the point at which a business stops losing money and starts generating operating profit.
For students, it is a practical application of cost behavior and contribution margin. For working professionals, it is a planning tool that can shape pricing, hiring, marketing spend, cash planning, and performance targets.
🧭 Start With the Right Meaning of Break-Even
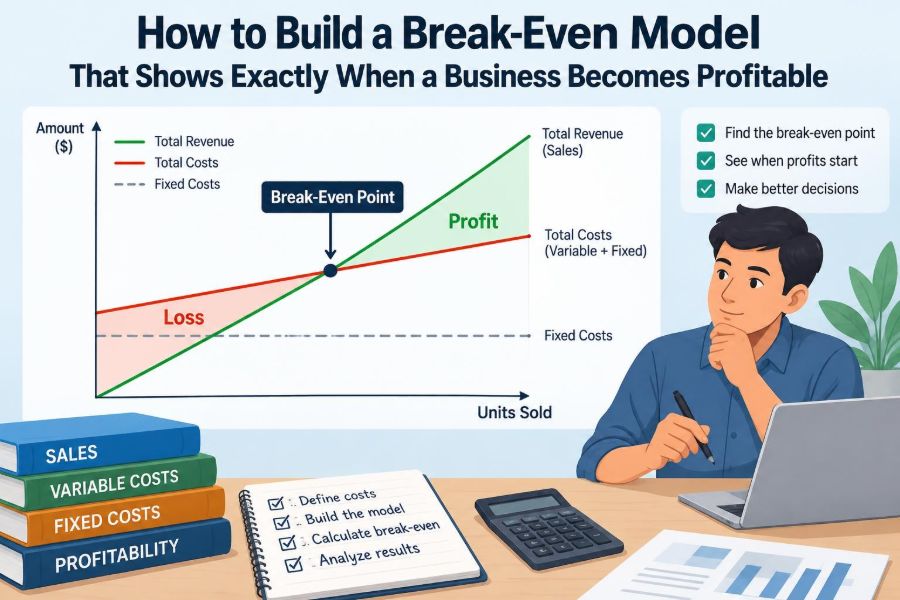
Break-even occurs when total revenue equals total costs for a defined period or level of activity. At that point, operating profit is zero: the business has recovered its costs, but has not yet earned a surplus.
It does not mean the business has repaid startup investment, accumulated enough cash to feel secure, or created value for owners. Those may be important goals, but they are different milestones.
A useful model states its scope clearly. For example: “Monthly operating break-even before interest and tax,” or “Break-even for the new product line after direct launch costs.”
🎯 Define the Decision the Model Must Support
Models are most reliable when built for a specific decision. A café owner may need to know the daily number of transactions required to support longer opening hours. A software company may need to know how many subscriptions justify adding a sales representative.
Write the decision at the top of the workbook before entering numbers. This prevents a common problem: constructing a mathematically correct model that answers a question nobody is actually asking.
- Set a pricing target.
- Assess whether a new product can cover its costs.
- Plan the sales volume required next quarter.
- Compare a fixed-cost investment with an outsourced alternative.
- Estimate the month when a growing business turns profitable.
🗓️ Choose a Time Period Before Calculating
Break-even is always tied to a period. Monthly models are common because many fixed costs, such as rent and salaries, are paid monthly and management reporting often follows that rhythm.
Daily or weekly models can be useful for retail, hospitality, events, and seasonal operations. Annual models help with strategic planning, but they can hide short-term losses or cash shortages within the year.
Use one consistent period for revenue, variable costs, and fixed costs. Mixing daily sales with monthly rent without converting one side creates an invalid result.
🧱 Separate Fixed Costs From Variable Costs
The core of break-even analysis is cost behavior. Fixed costs are costs that generally stay unchanged within a relevant operating range, even when sales volume changes. Rent, base salaries, insurance, and accounting software subscriptions often behave this way in the short run.
Variable costs change with the number of units sold, produced, delivered, or served. Materials, payment processing fees, sales commissions, shipping, and piece-rate labor may be variable.
“Fixed” and “variable” do not describe whether a cost is necessary or recurring. They describe how the cost moves when activity changes.
🔍 Treat Mixed Costs With Care
Many real costs are mixed: they have a fixed base plus a volume-related element. A phone plan may charge a base subscription plus usage fees. Utilities may include a standing charge plus consumption. Production labor may include salaried supervision and hourly overtime.
Splitting a mixed cost improves the model. If a reliable breakdown is unavailable, document the assumption and test a reasonable range rather than pretending the entire cost is fixed or variable.
The goal is not perfect classification. It is a model accurate enough for the decision, with uncertainty made visible.
📦 Define the Unit That Drives Economics
A break-even calculation needs a unit. For a manufacturer, the unit may be one finished product. For a consulting firm, it may be a billable hour. For a restaurant, it may be a customer cover or an average order.
The best unit is the one that links price, direct cost, and operational capacity. If a business sells many products, a single “unit” may be misleading unless it represents a stable sales mix.
For a subscription business, the relevant unit may be an active customer-month rather than a customer acquired once. That distinction matters because recurring revenue and ongoing support costs occur over time.
💵 Calculate the Selling Price Net of Reductions
Use the revenue the business truly keeps per unit, not the list price printed on a menu or catalogue. Discounts, refunds, rebates, marketplace commissions charged as a percentage of sales, and expected returns can reduce effective revenue.
If a product lists for $100 but the typical discount is 10%, the model should normally begin with $90 of net revenue before considering direct costs. Where sales tax is collected on behalf of a government, it is usually not revenue available to cover costs.
Use average realized price when customer prices vary. Keep the source data nearby so the assumption can be reviewed.
➖ Find Variable Cost Per Unit
Variable cost per unit includes every cost that predictably arises because one more unit is sold. For a physical product, that can include materials, packaging, fulfillment, transaction fees, and a unit-based commission.
For a service, it may include contractor time, payment fees, consumable supplies, or support time that scales materially with each customer. Avoid placing all payroll in fixed costs simply because employees are paid monthly; some labor may increase directly with workload.
Variable cost should reflect the cost of delivering the promised product or service, not merely the cost of making it.
🧮 Calculate Contribution Margin Per Unit
Contribution margin is the amount each unit contributes toward fixed costs and then profit. It is calculated as:
Contribution margin per unit = Net selling price per unit − Variable cost per unitIf a product produces $80 of net revenue and has $30 of variable costs, its contribution margin is $50. The first $50 from each sale helps absorb fixed costs. Once all fixed costs are covered, further contribution becomes operating profit, assuming the underlying cost behavior remains unchanged.
This is why revenue alone is a weak measure of progress. Two products with the same sales value can contribute very different amounts to profitability.
📊 Use Contribution Margin Ratio for Revenue-Based Planning
The contribution margin ratio expresses contribution as a percentage of revenue. It is especially useful when the business sells several items or when management thinks in sales dollars rather than units.
Contribution margin ratio = Contribution margin per unit ÷ Net selling price per unitUsing the earlier example, $50 divided by $80 equals 62.5%. In simplified terms, every additional $1 of net sales contributes $0.625 toward fixed costs and profit.
The ratio is only dependable when the product mix and pricing are reasonably stable. If high-margin products suddenly make up a smaller share of sales, the historical ratio can overstate profitability.
⚖️ Calculate the Basic Break-Even Point in Units
Once fixed costs and unit contribution are known, the basic formula is straightforward:
Break-even units = Fixed costs ÷ Contribution margin per unitSuppose monthly fixed costs are $20,000 and contribution margin is $50 per unit. Break-even volume is 400 units. Since partial sales may not be possible, operational planning should round up: the business needs 400 complete units to break even in this example.
This calculation assumes one product, a constant selling price, constant variable cost per unit, and fixed costs that remain stable over the volume range considered.
💰 Calculate Break-Even Sales Revenue
When unit counts are not meaningful or product mix is broad, calculate the required revenue instead:
Break-even revenue = Fixed costs ÷ Contribution margin ratioWith $20,000 of fixed costs and a 62.5% contribution margin ratio, break-even revenue is $32,000. At that revenue level, expected contribution equals fixed costs.
This is not a substitute for operational detail. A revenue target becomes useful only when the sales team understands how many customers, orders, projects, or billable hours it represents.
🏗️ Build the Model in a Transparent Sequence
A strong break-even workbook makes its logic easy to audit. Avoid burying assumptions inside long formulas or typing numbers repeatedly in several places.
- Create a clearly labeled assumptions area for price, volume, costs, and timing.
- Calculate unit economics: net price, variable cost, and contribution margin.
- Calculate fixed costs by period.
- Build a volume or monthly forecast.
- Calculate revenue, total variable cost, contribution, fixed cost, and profit.
- Display the break-even point and key scenarios in a summary area.
Separate inputs from calculations and outputs. A reviewer should be able to change one assumption and immediately see which results move.
🧾 Use a Simple Profit Equation as a Control Check
Every model should reconcile to a simple profit equation:
Operating profit = Revenue − Total variable costs − Fixed costsThe same result can also be expressed as:
Operating profit = Total contribution margin − Fixed costsIf those two calculations do not produce the same answer, there is likely a classification error, a missing cost, or inconsistent timing. This check is simple but catches many spreadsheet mistakes.
📈 Turn a Volume Model Into a Monthly Forecast
A break-even volume tells you how muchwhen
Place months in columns or rows, forecast unit volume for each month, and calculate monthly revenue, variable cost, contribution, fixed cost, and operating profit. The first month with positive operating profit is the monthly profitability milestone.
Use forecasted volume rather than a smooth straight line if seasonality, a launch date, sales cycles, or capacity constraints create uneven demand.
📉 Distinguish Monthly Profitability From Cumulative Break-Even
A business can report a profitable month while still carrying cumulative losses from earlier months. This is especially common during launch periods, when fixed costs begin before sales ramp up.
Add a cumulative profit or loss line to the model. Start with any pre-launch losses or setup costs included in the scope, then add each month’s operating result. The point where cumulative profit turns positive is cumulative break-even.
Both measures are useful. Monthly profitability shows that current operations can support themselves. Cumulative break-even shows when prior losses have been recovered under the model’s assumptions.
🧪 Work Through a Hypothetical Example
Consider a hypothetical online course provider. Its average net revenue per enrollment is $240 after expected refunds. Direct instructor support, payment processing, and learner materials average $60 per enrollment. Monthly fixed costs, including platform tools, marketing retainers, and salaried administration, are $18,000.
| Measure | Amount |
|---|---|
| Net revenue per enrollment | $240 |
| Variable cost per enrollment | $60 |
| Contribution margin per enrollment | $180 |
| Monthly fixed costs | $18,000 |
| Break-even enrollments | 100 |
The arithmetic is $18,000 divided by $180, or 100 enrollments. If the forecast is 70 enrollments in month one, 90 in month two, and 110 in month three, month three is the first month with operating profit. Cumulative break-even may occur later because the first two months generated losses.
🧠 Handle Multiple Products With a Sales Mix
Most businesses sell more than one product or service. In that case, separate break-even points for each item may not describe the business because all products share fixed costs.
Use a weighted average contribution margin based on expected sales mix. If a business expects 60% of unit sales from Product A and 40% from Product B, weight each product’s contribution by those proportions.
The result depends on the mix holding steady. A model should show the assumed mix prominently and include scenarios for a shift toward lower-contribution items.
🔄 Use Weighted Average Contribution Carefully
Suppose Product A contributes $70 per unit and Product B contributes $30 per unit, with an expected 60/40 mix. The weighted average contribution is $54 per composite unit: ($70 × 60%) + ($30 × 40%).
If fixed costs are $27,000, the model estimates break-even at 500 composite units. That does not mean exactly 300 units of A and 200 of B must be sold; it means the calculation assumes that mix on average.
When product mix is volatile, build separate scenarios rather than relying on one blended number. Blended models are efficient, but they can conceal a major commercial risk.
🏷️ Test Price Changes Before Making Them
A price increase raises contribution margin if variable costs remain unchanged, reducing break-even volume. But demand may decline, discounts may rise, or customers may trade down to lower-priced offerings.
A price reduction can increase volume, yet it also means each sale covers less fixed cost. The relevant question is not whether volume rises, but whether the additional volume is enough to compensate for the lower contribution per unit.
Model at least three cases: current price, proposed price with unchanged volume, and proposed price with a realistic volume response range. Do not present the result as a certainty when customer behavior is unknown.
📦 Model Capacity Before Trusting a Target
A break-even calculation can produce a target that operations cannot achieve. A clinic may need more appointments than its staff can provide. A factory may need more units than its equipment can produce. A consultant may need more billable hours than exist in a month.
Compare break-even volume with realistic capacity. Include utilization assumptions, downtime, lead times, staffing availability, and quality requirements where they materially affect output.
If required volume exceeds capacity, the answer is not “sell harder.” The business must reconsider price, variable cost, fixed cost, capacity, or the underlying business design.
🪜 Account for Step-Fixed Costs
Fixed costs often remain fixed only within a range. A business may need another supervisor after reaching a certain headcount, a second warehouse after filling the first, or a new software tier after crossing a user limit.
These are step-fixed costs: costs that jump when activity crosses a threshold. A single break-even line can be misleading if it ignores them.
Model volume bands. For each band, apply the fixed costs actually required at that scale, then calculate profit. This creates a more realistic picture of profitability as the business grows.
🧷 Include Relevant Costs, Exclude Irrelevant Noise
The model should include costs that are caused by or necessary for the decision. For a whole-business operating break-even model, that normally includes all ongoing operating costs needed to run the business.
For a decision about one product, costs that will continue regardless of whether the product exists may be less relevant in the short term. However, excluding shared costs can make a product appear sustainable when it is not supporting the organization’s long-run cost base.
State whether shared overhead is fully allocated, partially allocated, or excluded. There is no universally correct choice; the right treatment depends on the decision horizon and purpose.
💳 Keep Profitability Separate From Cash Flow
Break-even analysis measures profit, not necessarily cash. A profitable sale may create a receivable that is collected later. Inventory may require cash before it is sold. Loan principal repayments and equipment purchases may consume cash without appearing as operating expenses in the same way.
For a business under financial pressure, pair the break-even model with a cash forecast. Include collection timing, supplier payment terms, inventory purchases, taxes, debt service, and planned capital expenditures as relevant.
A business can be profitable on paper and still face a cash shortage. The two views should inform each other, but they should not be confused.
🧾 Decide How to Treat Depreciation, Interest, and Tax
For operating decisions, many teams calculate break-even before interest and tax because financing and tax positions vary independently of core operations. Depreciation may be included when measuring accounting operating profit, though it is a non-cash expense in the period.
There is no single presentation that fits every purpose. The key is consistency and labeling. “Break-even before interest and tax” is different from “cash break-even after debt payments.”
When a model will be used for investment, lending, tax, or legal decisions, obtain appropriate professional review. A simplified management model should not be treated as a complete financial forecast.
🌦️ Build Scenarios Instead of One Fragile Forecast
A single forecast can create false confidence because it hides uncertainty in one set of assumptions. Scenario analysis makes uncertainty explicit.
- Base case: the most supportable assumptions from current evidence.
- Downside case: lower volume, lower price realization, higher costs, or slower collections.
- Upside case: stronger demand or improved unit economics, while remaining operationally feasible.
Scenarios should change the assumptions that genuinely drive the result. A downside case that merely reduces sales by an arbitrary amount is less useful than one tied to a known risk such as customer concentration or seasonality.
🎛️ Use Sensitivity Analysis to Find the Real Drivers
Sensitivity analysis changes one assumption at a time to show its effect on break-even. It helps management focus on variables with enough leverage to justify attention.
Test unit price, variable cost per unit, fixed costs, sales mix, and volume. A small change in contribution margin can have a large effect when fixed costs are high or current margins are thin.
A simple sensitivity table can reveal whether the business is most exposed to material prices, discounting, payroll, or customer demand. That insight is often more valuable than a single break-even number.
🚧 Watch for Assumptions That Break the Model
Break-even models simplify reality. They work best over a relevant range where prices, unit costs, and capacity are relatively stable. Beyond that range, bulk discounts, overtime, new facilities, competitive reactions, or supply constraints can change the economics.
Demand is another limitation. The model can tell you the sales volume needed to break even; it cannot prove that customers will buy that volume at the modeled price.
Document major assumptions in plain language. A transparent limitation is safer than a precise-looking output built on hidden uncertainty.
🛑 Avoid Common Break-Even Modeling Mistakes
Most errors come from judgment and data handling, not the formula itself. A model should be reviewed with the people who understand operations, sales, and cost behavior.
- Using list price instead of realized net revenue.
- Omitting transaction fees, returns, delivery, or customer support from variable costs.
- Treating all labor as fixed when staffing expands with volume.
- Ignoring sales mix in a multi-product business.
- Assuming fixed costs never step up.
- Calling a positive month “recovery” without checking cumulative losses.
- Using profit break-even as a substitute for cash planning.
- Failing to update assumptions after actual results arrive.
🔁 Compare Forecasts With Actual Results
A break-even model becomes more useful after it is used, reviewed, and revised. Each month, compare actual price, volume, variable cost, fixed cost, and product mix with the forecast.
Do not only ask whether the final profit result was right. Ask which driver differed and why. Perhaps discounting rose, supplier costs changed, a product mix shifted, or a fixed-cost item was omitted.
This feedback loop improves future decisions. It also turns the model from a static spreadsheet into a management discipline.
🗣️ Present the Result So People Can Act on It
Decision-makers need a concise answer, not a wall of formulas. A clear summary usually includes the break-even units or revenue, expected monthly profitability date, cumulative break-even date, key assumptions, and the two or three risks that could materially change the result.
A chart of monthly revenue, fixed costs, and profit can help, but the chart should support—not replace—the numbers. Label whether results are monthly or cumulative, and identify the scenario shown.
Translate the target into operational language: “We need 12 additional orders per business day,” or “We need to raise utilization from 58% to 71%.” Actionable framing connects finance to operations.
✅ Make the Model a Decision Tool, Not a One-Time Calculation
The central principle is simple: profitability begins when total contribution margin covers the relevant fixed cost base. Building a useful model requires more than applying that formula. It requires sound definitions, realistic unit economics, timing, capacity checks, and honest uncertainty.
Start with a transparent monthly model, then improve it as better evidence becomes available. The most valuable break-even model is not the most elaborate one; it is the one that makes the next decision clearer and exposes the assumptions behind it.
A break-even model shows exactly when profitability is expected only when its prices, costs, volume, mix, and timing assumptions are explicit, testable, and regularly updated.
Used this way, break-even analysis turns a vague hope that sales will eventually cover costs into a measurable operating plan—and a better conversation about what must change when the numbers do not yet work. 📈🧮