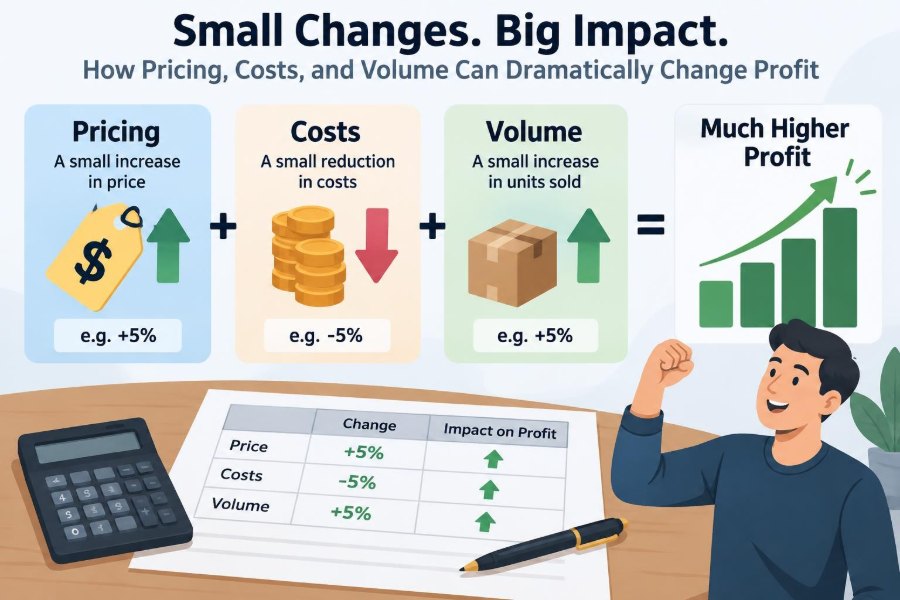

A café raises the price of its most popular lunch by a small amount. A manufacturer trims waste from one production step. A freelance designer accepts a few more projects each month. None of these decisions sounds dramatic on its own.
Yet each can change profit far more than expected. That is because profit is not simply a sales number minus an expense number. It is the result of several moving parts interacting: price, unit cost, sales volume, and the fixed costs that must be paid whether a business sells one unit or one thousand.
This is the practical logic behind cost-volume-profit analysis, often called CVP analysis. It helps managers, owners, and accounting students see how routine commercial changes flow through to the bottom line.
The goal is not to predict the future with false precision. It is to ask better questions: How many more units must we sell after a discount? Can a small cost saving fund a price reduction? Is growth actually making the business more profitable?
📈 Profit Is a Relationship, Not a Standalone Number
At its simplest, profit equals revenue minus costs. Revenue comes from selling units at a given price, while costs include both costs that rise with activity and costs that remain relatively stable over a relevant period.
A useful operating-profit model is:
Profit = (Selling price per unit − Variable cost per unit) × Units sold − Fixed costs
This formula makes the relationship visible. A change in price or variable cost affects the profit earned on every unit. A change in volume affects how many times that unit profit is earned. Fixed costs set the hurdle that contribution must clear.
🧩 The Four Building Blocks of the Model
CVP analysis begins with four inputs. They are estimates, not permanent truths, but they create a disciplined starting point for decisions.
- Selling price: the amount charged per unit, job, subscription, or service.
- Variable cost: the cost that changes in total as units are sold or produced, such as materials, sales commissions, or delivery packaging.
- Fixed cost: a cost that generally does not change in total within a relevant range, such as monthly rent or a manager’s salary.
- Sales volume: the number of units expected to be sold in the period.
The word “unit” can mean a physical item, an appointment, a billable hour, a customer account, or another consistent measure of activity.
➕ Contribution Margin: The Amount That Does the Work
Contribution margin is selling price minus variable cost. It is the amount from each sale available first to cover fixed costs and then to generate profit.
Suppose a bakery sells a cake for $30 and incurs $12 of ingredients, packaging, and sales-related variable costs. Its contribution margin is $18 per cake. The bakery does not immediately “profit” by $18, because rent, insurance, equipment depreciation, and other fixed costs still need to be covered.
Once fixed costs are covered, however, additional contribution usually becomes operating profit, provided the cost assumptions still hold.
🔢 A Simple Baseline Example
Consider a hypothetical online retailer selling one product for $50. Variable cost is $30 per unit, monthly fixed costs are $20,000, and expected sales are 1,500 units.
| Item | Calculation | Monthly amount |
|---|---|---|
| Revenue | $50 × 1,500 | $75,000 |
| Variable costs | $30 × 1,500 | $45,000 |
| Contribution margin | $20 × 1,500 | $30,000 |
| Fixed costs | Given | $20,000 |
| Operating profit | $30,000 − $20,000 | $10,000 |
This baseline is valuable because it gives management something concrete to compare against. A proposed price change, supplier quote, or sales forecast can be tested against the same structure.
🏷️ Why a Small Price Increase Can Matter So Much
If the retailer increases price from $50 to $51 and keeps sales volume and costs unchanged, contribution margin rises from $20 to $21 per unit. Across 1,500 units, that extra dollar produces $1,500 of additional profit.
The crucial point is that no new fixed cost was assumed. A small price change can therefore have a direct and repeated effect on contribution.
But price increases are rarely costless in the market. Customers may buy less, switch to a competitor, reduce order size, or perceive lower value. The relevant question is not “Can we raise price?” but “How much volume can we lose before the change stops helping?”
⚖️ Price Elasticity Sets the Commercial Limit
Price elasticity of demand describes how responsive customer demand is to a price change. Demand is relatively elastic when a modest price increase causes a meaningful fall in quantity demanded. It is relatively inelastic when volume changes little.
A business with many close substitutes may face elastic demand. A provider with a differentiated offer, strong customer relationships, or an urgent service may face less elastic demand. These are tendencies, not guarantees.
Accounting can calculate the volume consequences of a proposal, but it cannot determine customer behavior alone. Pricing decisions need market knowledge alongside the numbers.
🎯 Finding the Volume a Price Increase Can Lose
In the retailer example, current total contribution is $30,000. At a $51 price and unchanged $30 variable cost, contribution is $21 per unit. The business needs about 1,429 units to maintain $30,000 of contribution.
That means it could lose roughly 71 units from its original 1,500-unit volume and still maintain the same operating profit, assuming fixed costs remain unchanged. This is a useful indifference calculation.
It does not prove that customers will accept the new price. It shows the sales decline the business can economically tolerate under the stated assumptions.
🏷️ Discounts Need More Than a Sales Story
Discounts can increase traffic, improve capacity utilization, clear inventory, or win strategically valuable customers. They can also destroy contribution margin quickly.
If the retailer cuts its price from $50 to $48 while variable cost stays at $30, contribution falls from $20 to $18 per unit. To maintain its original $30,000 contribution, it must sell about 1,667 units rather than 1,500.
That is an additional 167 units, or more than an 11% volume increase. A discount should therefore be evaluated against the incremental volume required, not just the prospect of higher sales revenue.
🛒 Revenue Growth Can Hide a Profit Decline
Managers often celebrate sales growth because it is visible and easy to report. Yet revenue can rise while profit falls if the growth comes from lower-margin products, deeper discounts, more costly customers, or expensive fulfillment.
For example, selling 20% more units at a sharply reduced contribution margin may create more work, more cash tied up in inventory, and less operating profit. Revenue alone does not reveal economic quality.
A useful reporting habit is to review sales by product, channel, customer type, and margin band. Growth is most valuable when it adds adequate contribution after the costs required to serve it.
🧾 Variable Costs Move With Every Sale
Variable costs often include direct materials, transaction fees, piece-rate labor, sales commissions, freight paid per order, and consumable supplies. They vary in total with activity, even though the cost per unit may initially appear stable.
A $0.50 reduction in variable cost is economically similar to a $0.50 price increase in a basic CVP model: both raise contribution margin by $0.50 per unit. The business earns the benefit on every relevant sale.
That similarity does not mean the decisions are equally easy. A price increase is customer-facing; a cost reduction may require supplier negotiation, redesign, process improvement, or a change in quality.
🔧 Cost Savings Must Protect Customer Value
Not all cost cutting is good cost management. Cheaper materials may increase returns. Reduced support staffing may lengthen response times. Lower-cost shipping may damage customer experience.
A sustainable saving removes waste, redesigns work, improves purchasing terms, reduces defects, or prevents rework without undermining the promise customers are buying. The accounting calculation should include likely secondary effects where they can be reasonably estimated.
Ask a practical question: will this saving create a larger cost somewhere else, such as warranty claims, lost repeat business, overtime, or reputational damage?
🏭 Fixed Costs Create Operating Leverage
Operating leverage describes how a business with fixed costs can experience relatively large profit changes when sales volume changes. Fixed costs do not disappear when sales soften, so a drop in contribution can reduce profit rapidly.
The opposite is also true. Once a business has covered fixed costs, further sales can add profit quickly if contribution margin holds. A software business with substantial development costs but low incremental delivery costs is a familiar example, though it may still face customer-support and infrastructure costs as it grows.
High operating leverage can be attractive, but it increases exposure when demand is uncertain.
🏢 Fixed Costs Are Fixed Only Within a Range
Calling a cost fixed does not mean it never changes. It means it is stable within a particular relevant range of activity and time.
A restaurant may pay the same rent whether it serves 100 or 200 meals in a day. If demand rises beyond kitchen capacity, however, it may need another shift, more equipment, or larger premises. Fixed costs then step up.
Forecasts should identify these capacity thresholds. Assuming that every extra sale earns the current contribution margin can overstate profit when new infrastructure or supervision is required.
📉 Break-Even Point Marks the Starting Line
The break-even point is the sales level at which total contribution exactly covers fixed costs and operating profit is zero.
Break-even units = Fixed costs ÷ Contribution margin per unit
For the retailer, break-even volume is 1,000 units: $20,000 divided by $20 per unit. At 1,000 units it covers fixed costs; above that point it earns profit under the model; below it, it incurs a loss.
Break-even is not a target to celebrate. It is a minimum operating threshold that helps show the scale of sales needed to support the current cost structure.
🛟 Margin of Safety Shows the Buffer
Margin of safety measures how far expected sales are above break-even sales. It can be expressed in units, revenue, or as a percentage of expected sales.
With expected sales of 1,500 units and break-even sales of 1,000 units, the retailer has a 500-unit margin of safety. That buffer indicates how much volume could decline, under the simplified assumptions, before it reaches break-even.
A narrow margin of safety deserves attention, particularly for seasonal, cyclical, or highly competitive businesses. It is not a prediction of failure; it is an exposure indicator.
📊 The Contribution Margin Ratio Helps With Revenue Planning
The contribution margin ratio is contribution margin divided by sales revenue. It shows the proportion of each sales dollar available to cover fixed costs and profit.
In the retailer example, contribution is $20 on a $50 sale, so the ratio is 40%. If the sales mix is stable, break-even revenue can be calculated as fixed costs divided by this ratio: $20,000 ÷ 40% = $50,000.
This ratio is particularly useful when units are difficult to define, such as a consulting practice with varied assignments. It becomes less reliable when the mix of services changes materially.
🧺 Product Mix Changes the Answer
Many businesses sell more than one product. In that setting, there is no single universal contribution margin unless management assumes a particular sales mix: the expected proportion of each product sold.
A retailer may sell a high-margin accessory alongside a lower-margin core product. If customers shift toward the lower-margin item, overall contribution can decline even when total unit sales remain stable.
Break-even calculations for multi-product businesses therefore depend on the assumed mix. A blended margin is useful for planning, but it should be monitored rather than treated as permanent.
🔍 Analyze the Incremental Decision, Not the Average
For a short-term decision, the key question is often whether an option adds more revenue than the relevant costs it creates. Relevant costs are future costs that differ between alternatives.
Imagine a hotel considering a one-night group booking during an otherwise quiet period. The room’s share of annual building costs will exist either way. The decision may depend more on incremental cleaning, utilities, breakfast, booking fees, and any effect on regular customers.
This does not mean fixed costs can be ignored forever. They matter for long-run pricing and capacity decisions. It means they may not change because of one additional short-term sale.
🧠 Avoid Treating Sunk Costs as a Reason to Continue
A sunk cost is a cost already incurred that cannot be recovered through the current choice. Past spending can be emotionally powerful, but it should not determine whether a future action creates value.
If a business has spent money developing a product, that spending may be relevant to performance evaluation and long-term learning. It does not automatically justify continuing to produce an item that cannot cover its future avoidable costs.
Good decisions distinguish historical cost reporting from forward-looking choice. Accounting supports both purposes, but they use information differently.
🧮 Build a Sensitivity Analysis Instead of One Forecast
A single forecast can create unwarranted confidence. Sensitivity analysis tests what happens when one or more assumptions change, such as price, volume, material cost, or labor efficiency.
A practical model might include a base case, a cautious case, and an upside case. The value lies in seeing which variable matters most and where profit turns negative.
- What happens if volume is 10% below plan?
- What if a supplier raises the unit cost?
- What if the discount generates only half the expected new demand?
- At what volume does another employee or machine become necessary?
These questions expose the assumptions that deserve the closest management attention.
🌊 Volume Can Create New Costs Before It Creates More Profit
Growing volume may require overtime, expedited freight, extra quality checks, larger warehouse space, or additional customer-service capacity. Some of these costs are variable; others are step-fixed costs that appear in chunks.
For this reason, a capacity-constrained business should not use its normal contribution margin without adjustment. The next 100 units may have a lower margin than the previous 100 units.
Operational data matters here. Finance teams need input from production, logistics, sales, and service teams to understand the real economics of growth.
💵 Profit Is Not the Same as Cash Flow
A profitable sale can still strain cash. A business may pay suppliers before collecting from customers, hold inventory for weeks, or offer generous payment terms to win orders.
Conversely, a customer deposit may improve cash before the related revenue is recognized. CVP analysis focuses on operating profit, not the timing of cash receipts and payments.
When volume expands, management should pair profit analysis with working-capital planning. Inventory, receivables, and payables can determine whether a profitable growth plan is financially feasible.
🧾 Taxes, Interest, and Accounting Boundaries Matter
CVP analysis usually focuses on operating profit before financing costs and income taxes. That scope is helpful because it isolates operating decisions, but users should be clear about what the result does and does not represent.
Interest expense, tax effects, depreciation methods, and accounting policies may matter for reported net income, cash flow, and valuation. A simple contribution model is a management tool, not a replacement for complete financial statements.
For regulated pricing, contractual bids, or major investment decisions, businesses may need more detailed analysis and appropriate professional advice.
🧱 Beware of Averages That Hide Complexity
Average unit costs can be useful at a planning level, but they can hide different customer behaviors. One customer may order in bulk with little support. Another may place small urgent orders, return goods frequently, and require extensive service.
Both may appear equally profitable under a simple average-cost system. In reality, their cost-to-serve can differ substantially.
Where the stakes justify it, businesses can examine activity drivers such as number of deliveries, purchase orders, support tickets, setups, and returns. This improves the quality of pricing and customer-profitability decisions.
🛑 Common Mistakes in Price-Cost-Volume Decisions
Several errors recur because they are intuitively appealing but economically incomplete.
- Cutting price without calculating the extra volume required to preserve contribution.
- Using revenue growth as proof that profitability improved.
- Classifying every cost as fixed or variable without checking how it behaves at different activity levels.
- Assuming capacity is unlimited and that current unit costs will remain unchanged.
- Ignoring product mix, customer mix, returns, discounts, and channel fees.
- Using a precise-looking forecast without testing its assumptions.
The remedy is not a more complicated spreadsheet for its own sake. It is making the assumptions visible and reviewing whether they remain credible.
🗂️ A Practical Decision Worksheet
Before changing a price, launching a promotion, or accepting a large order, create a short decision worksheet. Keep the calculation transparent enough that operational colleagues can challenge it.
- Define the unit, time period, and decision being considered.
- Estimate incremental selling price, variable costs, and expected volume change.
- Identify fixed costs that will actually change, including capacity steps.
- Calculate the effect on total contribution and operating profit.
- Test a cautious scenario and identify the break-even volume.
- Consider nonfinancial effects: quality, customer relationships, staff workload, and cash needs.
- Record the assumption and compare it with actual results after implementation.
The final step turns a decision into learning. Over time, the business develops better estimates of demand response and cost behavior.
🤝 Finance Needs Commercial and Operational Context
Accounting provides structure, but it should not operate in isolation. Sales teams may understand customer objections; operations may know where bottlenecks occur; procurement may see supplier risk; customer-service teams may detect quality problems first.
The best analysis combines these perspectives. A model that is technically correct but based on unrealistic volume or capacity assumptions can still lead to a poor decision.
Equally, commercial enthusiasm benefits from financial discipline. A proposal becomes stronger when it clearly states how it will generate enough contribution to cover the resources it requires.
📅 Review Assumptions as Conditions Change
Prices, wages, freight charges, exchange rates, supplier terms, and customer behavior change over time. A contribution margin calculated six months ago may no longer describe current economics.
Review high-impact assumptions on a regular schedule and after major changes. Focus especially on products with thin margins, volatile input costs, large sales volumes, or heavy promotional activity.
Timely review is not about chasing every small fluctuation. It is about preventing old assumptions from quietly driving current decisions.
🧭 Use the Model as a Guide, Not an Oracle
CVP analysis relies on simplifying assumptions: units can be measured consistently, cost behavior is reasonably understood, selling prices are known, and the relevant sales mix is stable enough for the analysis to be useful.
Real businesses are more complicated. Demand may shift abruptly, costs may be nonlinear, and qualitative factors may outweigh a short-term margin calculation. Those limitations do not make the tool weak; they define where judgment must enter.
A good model makes uncertainty explicit. It helps decision-makers see what must be true for a plan to work.
🌟 The Core Principle: Protect and Grow Contribution
Small shifts in price, variable cost, and volume can produce large changes in profit because they affect contribution repeatedly across many sales. Fixed costs then amplify the result: before break-even, contribution reduces loss; after break-even, it generally increases profit.
The strongest decisions do not focus on one number in isolation. They ask how price affects demand, how costs affect value and capacity, how volume affects the cost structure, and whether the resulting cash demands are manageable.
That is the durable lesson of cost-volume-profit thinking: understand the economic chain from each sale to total profit, then test the assumptions before committing resources.
Profit improves not merely when a business sells more, charges more, or spends less, but when it improves the contribution earned from its available resources without creating larger hidden costs elsewhere. That is a calculation worth revisiting whenever a seemingly small change is on the table. 💰📊🧭