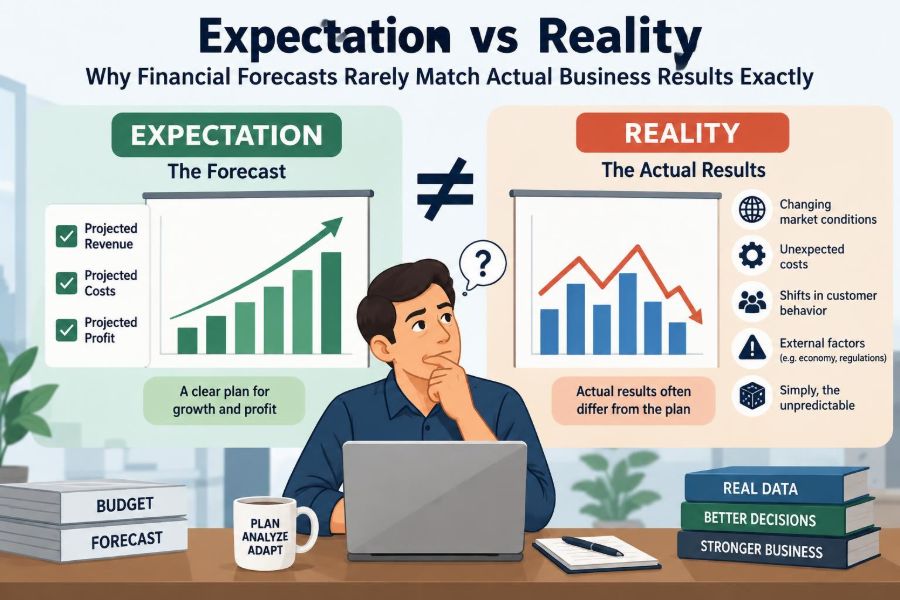

A sales team closes a promising quarter and expects revenue to land above plan. A week later, several customer orders are delayed, a supplier raises prices, and a large invoice cannot be recognized until the next month. The forecast that looked sensible on Monday is suddenly wrong by Friday.
This experience is familiar in businesses of every size. Finance teams build budgets, lenders request projections, managers make hiring decisions, and investors assess plans—all using estimates about a future that has not happened yet.
When actual results differ from a forecast, the difference can feel like a failure. Sometimes it is. But a mismatch is often the normal result of uncertainty, timing, changing conditions, and imperfect information rather than poor financial discipline.
The useful question is not, “Why was the forecast not exact?” It is, “What did the variance teach us, and how should it improve the next decision?”
🔭 A Forecast Is a Model of the Future
A financial forecast is a structured estimate of future business results. It may project revenue, costs, cash flow, profit, inventory, staffing needs, or financing requirements over weeks, months, or years.
Every forecast turns assumptions into numbers. For example, projected sales may be based on expected customer demand, conversion rates, average selling prices, sales capacity, and the likelihood that orders will arrive on schedule.
That makes a forecast a model, not a promise. Like a map, it is valuable because it helps people navigate, even though it cannot reproduce every turn, obstacle, or change in weather.
🎯 Precision Is Not the Same as Accuracy
A spreadsheet can display revenue as 1,247,386.42, but the decimal places do not make the estimate reliable. This is called false precision: presenting a highly specific number when the underlying assumptions are uncertain.
Accuracy means closeness to the eventual actual result. Precision means how finely a number is stated. A forecast can be very precise in appearance and still be materially inaccurate.
For planning, a sensible range can be more informative than a single point estimate. Expected monthly sales of 1.1 to 1.3 million, with the drivers clearly stated, may support better decisions than an unexplained forecast of 1.2 million.
🧭 The Forecast’s Purpose Shapes Its Design
Not all forecasts are built for the same job. A short-term cash forecast may need daily detail because payroll, supplier payments, and bank balances are immediate concerns. A three-year strategic plan needs less transaction-level detail and more attention to market direction and investment choices.
Using one forecast for every purpose can create confusion. A sales operating forecast, an annual budget, a liquidity forecast, and a valuation model can legitimately produce different numbers because they answer different questions.
- Operational forecasts guide near-term actions.
- Budgets establish targets, resource allocations, and accountability.
- Cash forecasts assess whether obligations can be paid on time.
- Strategic forecasts test longer-term choices and capacity needs.
🧩 Assumptions Drive More Than Formulas
Most forecast errors begin before anyone writes a formula. A model may calculate perfectly, but it cannot correct a weak assumption about demand, pricing, churn, wage growth, or payment timing.
Consider a hypothetical software company forecasting subscription revenue. If it assumes customers renew at the recent rate, the forecast may look stable. But if several large contracts are approaching renewal and customer budgets have tightened, that historical rate may no longer describe the coming period.
A strong model makes assumptions visible. Decision-makers should be able to ask what changed, who owns the assumption, what evidence supports it, and what happens if it proves wrong.
📈 Revenue Is Often the Most Uncertain Line
Revenue depends on customer behavior, which is difficult to control. Leads may convert more slowly, buyers may reduce order sizes, contracts may be delayed, competitors may discount, or customers may change priorities after a forecast is approved.
Even a signed order does not always mean revenue appears immediately. Delivery obligations, acceptance conditions, returns, cancellations, and applicable accounting rules can affect when revenue is recorded.
This is why finance teams should separate the question “Will we win the sale?” from “When will we recognize the revenue?” and “When will we collect the cash?” They are related, but they are not identical.
⏱️ Timing Differences Can Create Large Variances
A forecast can be directionally correct and still miss a reporting period because activity moved across a cutoff date. A shipment sent on the first day of the next month instead of the last day of the current month can shift reported sales, margin, receivables, and cash timing.
Timing is especially important near month-end and quarter-end. It can create apparent underperformance in one period followed by apparent overperformance in the next, even if the annual business outlook has changed little.
Variance analysis should therefore distinguish timing variances from permanent changes in demand or cost. Treating a delay as a lost sale can lead managers to make unnecessary corrections.
💵 Profit, Cash, and Revenue Follow Different Clocks
Revenue is not cash received, and profit is not cash available in the bank. A business can report a profit while struggling to pay suppliers if customers are paying slowly or inventory is absorbing cash.
For example, a retailer may sell goods profitably in December but pay suppliers before collecting card settlements or customer receivables. Its income statement may look strong while its short-term liquidity remains tight.
Forecasts that combine these measures without explaining the differences can mislead decision-makers. Good planning connects the income statement, balance sheet, and cash flow rather than treating them as separate stories.
🏷️ Price, Volume, and Mix Move Results Differently
Sales may miss forecast even when total units sold are close to plan. Customers might buy lower-priced products, choose discounted packages, or shift from higher-margin services to basic offerings.
These are mix effects: changes in the composition of sales. They matter because revenue and gross margin can move in different directions. Higher volume does not automatically mean higher profit.
Breaking a sales variance into price, volume, and mix gives managers a more useful explanation than simply saying revenue was below budget. It points toward different responses: revise pricing, improve sales conversion, protect product mix, or reconsider the plan.
🧾 Cost Behavior Is More Complicated Than “Fixed” or “Variable”
Forecasts often classify costs as fixed or variable. Fixed costs, such as rent under a lease, tend not to move with short-term sales volume. Variable costs, such as sales commissions or direct materials, tend to change as activity changes.
In reality, many costs are semi-variable or step-fixed. Customer support costs may remain stable until ticket volume reaches a threshold, after which additional staff are needed. Warehouse costs may jump when a business needs an extra shift or more storage space.
Forecasting all expenses as a flat percentage of sales can miss these thresholds. Cost models should reflect the operational drivers that actually cause spending to change.
📦 Supply Chains Introduce Cost and Availability Risk
Material shortages, freight disruption, supplier capacity limits, exchange-rate movements, and changing input prices can affect both cost and revenue. A company may have customer demand but lack the components needed to fulfill orders.
Supplier quotations are also snapshots, not guarantees unless contract terms provide protection. A forecast based on a recent purchase price may become outdated when a contract expires or purchasing volume changes.
Teams should identify the largest procurement exposures, not merely apply a broad inflation assumption to every cost category. A critical component with few substitutes deserves closer monitoring than a minor office expense.
🌦️ External Conditions Change the Starting Point
Economic conditions, interest rates, currency markets, regulation, weather, industry trends, and customer confidence can reshape business conditions after a forecast is finalized. These forces are often outside management’s direct control.
The lesson is not to predict every external event. It is to recognize which assumptions are sensitive to external conditions and to prepare possible responses.
A construction business, for instance, may use scenarios for material availability and project starts rather than relying on one assumption about market demand. Scenario planning does not eliminate uncertainty; it makes the exposure discussable.
🏢 Internal Decisions Also Change the Outcome
Actual results change because management acts. Hiring plans may be delayed, a product launch may be accelerated, credit terms may tighten, or marketing spend may be reallocated after early results arrive.
This can make a forecast-versus-actual comparison harder to interpret. If managers intentionally reduced advertising below plan, lower sales may not indicate a forecasting error alone. It may reflect a different operating decision.
Forecast reviews should record significant decisions made after the forecast was set. Without that context, teams can confuse the effect of changing actions with the quality of the original assumptions.
🧠 Human Judgment Creates Useful but Biased Estimates
Forecasting relies on judgment, especially where data is limited. Sales leaders may be optimistic about late-stage opportunities. Operational teams may build cautious buffers because they have experienced past shortages. Executives may focus on a target that has already been communicated.
These tendencies are understandable, but they can introduce bias. Optimism bias overstates favorable outcomes, while excessive conservatism can hide capacity needs or discourage worthwhile investment.
Good governance does not remove judgment. It challenges judgment constructively by asking for evidence, comparing past assumptions with outcomes, and separating an aspirational target from an expected outcome.
🗂️ Data Quality Limits Forecast Quality
A forecast inherits weaknesses from the data beneath it. Duplicate customer records, incorrect product classifications, late expense coding, outdated pricing, incomplete pipeline stages, and inconsistent definitions can all distort the model.
One common issue is using bookings, billings, revenue, and cash collections as if they mean the same thing. They measure different points in a commercial process. A dashboard that labels them imprecisely can create avoidable forecasting errors.
Before adding complex analytics, finance teams should confirm the basics: reconciled historical data, clear ownership, consistent definitions, and a documented process for correcting errors.
🔄 Historical Trends Help, Until They Do Not
Historical data provides a valuable starting point. Seasonal patterns, customer payment behavior, gross-margin trends, and conversion rates can reveal regularity that intuition misses.
But past data is not a permanent rule. A new product, changed sales channel, acquisition, pricing model, or major customer loss may make older patterns less representative. This is sometimes described as a change in the underlying business conditions.
Use history as evidence, not as an autopilot setting. Ask whether the process that produced the historical numbers still exists and whether current conditions are comparable.
🧪 Scenario Planning Makes Uncertainty Visible
A scenario is a coherent set of assumptions, not simply a best case and worst case with arbitrary numbers. A useful downside scenario explains what would cause lower results: slower conversions, weaker pricing, delayed collections, higher input costs, or some combination.
A basic planning set often includes a base case, an upside case, and a downside case. The value lies in identifying the assumptions that differ and the operational actions available in each case.
| Scenario | Illustrative assumption | Planning use |
|---|---|---|
| Base case | Pipeline converts at the expected rate | Sets the operating plan |
| Downside case | Large deals close later and collections slow | Tests cash protection and spending choices |
| Upside case | Demand improves without major capacity constraints | Tests hiring, inventory, and service capacity |
Scenarios should be credible, not theatrical. Their purpose is to support decisions before conditions force a rushed response.
📊 Sensitivity Analysis Finds the Critical Drivers
Sensitivity analysis changes one assumption at a time to see how much a result moves. For example, a company can test how a change in gross margin, payment days, or sales conversion affects profit or cash.
This method helps identify the variables worth managing closely. If a small change in customer payment timing creates a major cash shortfall, collections may deserve more attention than a minor variance in office expenses.
Its limitation is that real-world changes often occur together. A weak demand period can also pressure pricing and lengthen collections. Sensitivity analysis is therefore most useful alongside scenarios that consider connected movements.
📏 Forecast Horizon Determines Reasonable Detail
Forecast reliability generally declines as the horizon extends. Next week’s payroll may be known with considerable confidence; sales three years away depend on many more uncertain choices and events.
This does not make long-range planning pointless. It changes the level of detail that is appropriate. Longer horizons should focus on directional economics, capacity, funding needs, and strategic alternatives rather than monthly figures with excessive certainty.
A practical approach is to use a detailed near-term forecast, a less detailed medium-term outlook, and a high-level long-term plan. Detail should follow decision usefulness, not spreadsheet capability.
🔁 Rolling Forecasts Keep Plans Current
An annual budget can become stale as conditions change. A rolling forecast extends the planning horizon at regular intervals—for example, maintaining an outlook for the next twelve months as each month closes.
Rolling forecasts encourage teams to replace old assumptions with current information. They can be especially helpful in businesses with volatile demand, changing input costs, or rapid growth.
They also require discipline. Updating numbers without examining why assumptions changed simply creates a newer version of the same weak forecast. Each cycle should explain key movements and their implications.
🧮 Variance Analysis Turns Differences into Learning
A variance is the difference between an actual result and a plan, budget, or forecast. The accounting calculation is simple; the management interpretation is not.
Useful variance analysis asks whether the difference came from volume, price, mix, timing, foreign exchange, cost efficiency, accounting treatment, data correction, or a changed management decision. It also asks whether the cause is temporary, recurring, or still uncertain.
The goal is not to assign blame for every miss. It is to improve future estimates and identify actions that matter now. A recurring unfavorable margin variance may require a pricing or sourcing response, not another explanation after month-end.
🧱 Separate Controllable From Uncontrollable Variances
Some results are influenced directly by management choices, such as staffing levels, discount approvals, inventory purchases, or collection follow-up. Others arise from external conditions, such as a sudden supplier disruption or broader market weakness.
The distinction should be made carefully. “Uncontrollable” should not become an excuse to stop learning. Teams may not control an event, but they can often control contract design, contingency planning, customer concentration, or the speed of their response.
A balanced review asks two questions: what caused the variance, and what could the organization reasonably change to reduce exposure next time?
🚦Materiality Helps Teams Focus
Not every difference deserves the same investigation. Materiality means the significance of an item in the context of the business and the decision being made. A small travel variance may matter little, while a similar amount in a narrow-margin product line could be meaningful.
Finance teams can set review thresholds based on value, percentage movement, risk, and recurrence. A variance that is small once may be worth watching if it points to a process weakness that will compound over time.
Focusing on material drivers prevents review meetings from becoming a tour of minor spreadsheet differences. Attention is limited; it should go where decisions can change outcomes.
🗣️ Clear Communication Prevents Misinterpretation
A forecast is useful only if decision-makers understand its assumptions and limits. Presenting a single number without context invites people to treat it as certainty.
Strong reporting explains the expected result, the range of plausible outcomes where appropriate, the major drivers, the largest risks, and the actions being considered. It should also distinguish facts already observed from estimates about the future.
Simple language matters. Instead of saying “performance was unfavorable,” explain that unit demand was lower than expected, that the effect was partly offset by higher prices, and that two delayed shipments are expected next month if delivery conditions hold.
🤝 Cross-Functional Input Improves the Forecast
Finance owns the forecasting process, but it rarely owns all the information. Sales understands deal timing, operations understands capacity and supply constraints, human resources understands hiring plans, and procurement understands vendor exposure.
Cross-functional forecasting works best when participants bring evidence rather than advocacy. Sales pipeline information should be linked to defined stages and historical conversion experience; operational capacity should be connected to realistic throughput assumptions.
Finance adds value by reconciling these inputs, challenging inconsistencies, translating operational drivers into financial outcomes, and making trade-offs visible.
🧾 Version Control Preserves Accountability
Forecasts change for good reasons, but silent changes make learning impossible. If no one can see the prior estimate, the changed assumption, and the reason for revision, teams cannot tell whether forecast accuracy improved or merely disappeared from view.
Maintain a clear record of forecast versions, assumption changes, and the date each view was approved. This can be simple: a controlled model, a documented forecast calendar, and a concise change log are often more valuable than an elaborate system used inconsistently.
Version control also prevents a common mistake: comparing actual results against a revised forecast while claiming to evaluate the original plan.
⚠️ Common Practices That Weaken Forecasts
Some forecasting habits repeatedly reduce usefulness, even when the spreadsheets are technically sophisticated.
- Starting with a desired profit result and forcing assumptions to fit it.
- Using sales pipeline totals without considering probability, timing, or deal quality.
- Updating revenue while leaving related costs, working capital, and capacity unchanged.
- Assuming last year’s percentages will hold despite a changed business model.
- Reporting variances without assigning owners or identifying next actions.
- Confusing a budget target with the most likely expected result.
Each practice suppresses uncertainty rather than managing it. The result may be a cleaner report but a less dependable basis for decisions.
🛠️ A Practical Forecasting Rhythm
A reliable process does not need to be complicated. It needs a repeatable cadence that combines updated information with disciplined review.
- Close and reconcile the latest actual results.
- Identify the largest variances and determine their causes.
- Refresh the assumptions affected by new evidence.
- Update revenue, costs, working capital, cash, and capacity consistently.
- Test key sensitivities and scenarios.
- Document decisions, risks, owners, and actions.
This rhythm turns forecasting from an annual spreadsheet exercise into an ongoing management process.
🎓 Forecast Accuracy Should Be Measured Thoughtfully
Tracking forecast error can reveal whether estimates are improving. However, a single accuracy measure may encourage unhelpful behavior if people become afraid to report bad news early.
Evaluate accuracy by category and horizon. Near-term cash receipts may be assessed differently from annual revenue, and recurring revenue may be more predictable than project-based sales. Look for systematic bias as well as average error.
A forecast that is consistently optimistic deserves a different response from one that is sometimes high and sometimes low because of genuinely volatile conditions. The first may need governance changes; the second may need wider ranges and contingency plans.
🧭 The Goal Is Better Decisions, Not Perfect Prediction
Forecasting adds value when it helps a business decide whether to hire, invest, borrow, purchase inventory, adjust prices, conserve cash, or change priorities early enough for action to matter.
The strongest forecasts are transparent about uncertainty, linked to operational reality, and revised when evidence changes. They do not pretend that the future can be calculated exactly.
A forecast is successful when it improves preparedness and decision quality—not when it produces a single number that happens to match actual results by chance.
Actual results will continue to surprise even careful organizations. But when assumptions are visible, variances are investigated intelligently, and plans are updated with discipline, those surprises become information rather than merely disappointment. 📊💡