
It is Friday afternoon, payroll is due next week, and a large customer says its payment will arrive “soon.” The bank balance looks acceptable today, but that single word—soon—does not tell you whether there will be enough cash when rent, suppliers, tax, and wages leave the account.
This is the gap between knowing your current cash balance and managing cash. A profit and loss statement can show a profitable business while its bank account is under pressure, because profit records economic activity and cash records timing.
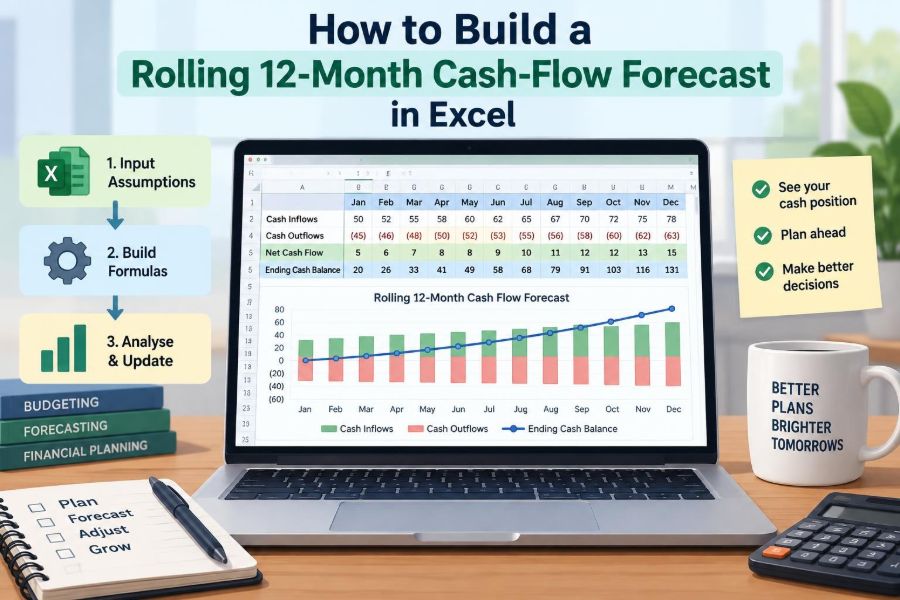
A rolling 12-month cash-flow forecast gives finance teams a practical forward view. It turns expected receipts and payments into a monthly map of liquidity, making shortfalls visible early enough to act.
Excel is well suited to this job when the model is structured, assumptions are visible, and the forecast is refreshed consistently. The goal is not to predict every transaction perfectly. It is to make better decisions with the information available.
🧭 Define what a rolling forecast is
A rolling 12-month cash-flow forecast estimates opening cash, incoming cash, outgoing cash, and closing cash for the next 12 monthly periods. When one month ends, actual results replace the estimate, that month drops away, and a new future month is added.
Unlike an annual cash budget that may be created once and left unchanged, a rolling forecast remains anchored to the latest information. In April, for example, the model might cover May through the following April.
💡 Separate cash forecasting from profit forecasting
Cash flow is driven by when money enters or leaves the bank, not when revenue or expense is recognized in the accounts. An invoice issued in March may be revenue in March but cash in May. A supplier bill may be expensed now and paid under agreed credit terms later.
That distinction means a useful forecast needs payment timing, not merely a copy of the budgeted income statement. Depreciation is a simple example: it affects profit but does not itself consume cash.
🎯 Choose the decisions the model must support
Start with the questions the workbook should answer. A forecast designed for daily treasury decisions needs more granular detail than one used to assess funding needs at a monthly management meeting.
- Can the business meet payroll, tax, debt, and supplier obligations?
- When might a bank facility or owner funding be needed?
- Is there capacity for inventory purchases, capital expenditure, or distributions?
- What happens if collections are slower or sales are lower than expected?
Defining the decision use prevents unnecessary detail and helps determine whether monthly periods are sufficient.
🗓️ Set the right time horizon and frequency
Twelve months is long enough to expose seasonality, annual payments, and medium-term funding pressure. It is also short enough for operating assumptions to remain meaningful in many businesses.
Monthly forecasting is a practical default. If cash is tight, add a separate 13-week weekly cash forecast for the near term; monthly columns can hide a short-term dip that occurs before a month-end receipt arrives.
🏗️ Design the workbook before entering numbers
A reliable workbook separates inputs, calculations, and reporting. Mixing assumptions and formulas in the same dense grid makes review difficult and increases the chance that someone overwrites a formula.
A sensible file may contain an Assumptions sheet, an Actuals sheet, a Forecast sheet, a Debt and Capex sheet, and a Dashboard or Summary sheet. Small models can use fewer sheets, but the logical separation still matters.
📁 Create a clean forecast layout
Set months across columns and line items down rows. Put a clear period label in each column, such as 31 May 2026, and use real Excel dates rather than typed text. Dates allow formulas, charts, and conditional formatting to work reliably.
Group rows in a sequence that mirrors cash movement: opening cash, cash receipts, cash payments, net cash movement, and closing cash. Place subtotals close to the underlying lines so a reviewer can trace the result quickly.
🔢 Build the monthly date engine
Enter the first forecast month-end date in one cell. In the next column, use =EOMONTH(B$4,1), adjusting the reference to match your layout, and copy it across 11 months. Format the result as mmm-yy.
The rolling mechanism begins here. A single control cell for the first forecast month can drive the entire horizon, so shifting the model forward does not require rewriting every header.
🏦 Establish the opening cash balance
The opening cash balance should come from the latest reconciled bank position, not an old general ledger figure that includes unreconciled items. If there are several bank accounts, decide whether the forecast shows each account separately or a consolidated cash position.
For the first forecast month, use a hard-linked actual balance. For later months, opening cash should equal the prior month’s closing cash. This continuity check is fundamental: cash cannot appear or disappear between periods without a recorded movement.
📥 Identify cash receipt categories
Receipts should be grouped at a level that supports action. Customer receipts, card settlements, grants, tax refunds, loan drawdowns, asset sale proceeds, and owner contributions may each behave differently.
Do not combine all inflows under “sales” if some income is immediate while another stream is collected after 60 days. Separate categories where collection timing, reliability, or decision relevance differs.
🧾 Forecast customer collections from invoices
For many businesses, the strongest method starts with the accounts receivable ledger. List open invoices by expected payment month, taking account of stated due dates, known disputes, credit notes, and specific customer promises.
This is more dependable than applying one percentage to total revenue when a few large invoices dominate cash flow. It also creates accountability: someone can explain why a named invoice moved from June to July.
When a schedule is unavailable
If detailed receivables data is not available, estimate collections using sales and typical payment patterns. For example, a hypothetical business whose customers generally pay 30% in the month of sale and 70% in the following month can apply those percentages to its sales forecast. Mark this clearly as an assumption, not a known collection schedule.
⏳ Model payment timing, not just invoice dates
Payment terms are a starting point, not a guarantee. Historical collection behavior, customer concentration, and current communication may justify a more cautious forecast than contractual due dates suggest.
Consider using three labels for material receivables: committed, probable, and at risk. This does not create certainty, but it prevents an optimistic assumption from being hidden inside a single total.
📤 Classify cash payments by behavior
Outflows usually include payroll, suppliers, occupancy costs, tax, debt service, operating expenses, capital expenditure, and distributions. Each category should be forecast using the driver that best explains its timing.
| Cash payment | Useful forecasting driver |
|---|---|
| Payroll | Payroll calendar and approved headcount |
| Supplier payments | Payables ledger, purchase orders, and terms |
| Rent | Lease payment schedule |
| Tax | Filing calendar and estimated liability |
| Loan repayments | Lender amortization schedule |
The principle is straightforward: use the closest available source to the actual payment obligation.
👥 Forecast payroll with the payment calendar
Payroll is often one of the least flexible cash outflows. Build it from the actual pay cycle: weekly, fortnightly, monthly, or a combination. Include wages, employer charges, pension contributions, bonuses, commissions, and expected termination or recruitment costs where relevant.
Check for months with an extra weekly or fortnightly pay run. A monthly forecast can otherwise understate cash needs in those periods, even though annual payroll looks reasonable.
📦 Forecast suppliers from payables and purchasing
Start with approved supplier invoices and the accounts payable aging report. Then add expected purchases that have not yet been invoiced, using purchase orders, inventory plans, contracts, or department forecasts.
Inventory businesses should be especially careful. A sales increase can improve future receipts while requiring an immediate purchase of stock, creating a temporary cash squeeze rather than an immediate cash benefit.
🏢 Schedule fixed operating costs accurately
Rent, insurance, software subscriptions, utilities, professional fees, and maintenance may be predictable, but their payment frequency varies. Annual insurance premiums and quarterly rents should appear in their actual payment month, not be smoothed evenly unless the cash genuinely leaves evenly.
Create a schedule for significant recurring costs and link its monthly totals into the main forecast. This keeps the main sheet readable while preserving support for each estimate.
🏛️ Include taxes, debt, and statutory payments
Tax payments can be substantial and are frequently missed when teams focus only on operating costs. Use the relevant filing and payment calendar, recognizing that tax rules and payment arrangements vary by jurisdiction and entity.
Record loan principal repayments, interest, commitment fees, and any planned drawdowns separately. Principal reduces cash but is not an operating expense; interest is often both a cash payment and an expense, though accounting timing may differ.
🏭 Treat capital expenditure as its own cash line
Capital expenditure, or capex, includes spending on equipment, systems, vehicles, fit-outs, and other long-lived assets. It may be excluded from operating budgets, yet it can materially affect liquidity.
List approved projects, expected deposit dates, milestone payments, financing proceeds, and likely contingencies. Do not assume a project is harmless simply because it is “one-off”; one-off payments are exactly what rolling forecasts should make visible.
➕ Calculate net movement and closing cash
The core formula is intentionally simple:
Closing cash = Opening cash + Total receipts - Total payments
Use formulas for all subtotals and closing balances. For a typical column, the closing cash cell might be =OpeningCash+TotalReceipts-TotalPayments. The next month’s opening cash should link directly to this closing cash cell.
A simple model is easier to audit. Complexity should come from well-supported assumptions, not from obscure arithmetic.
🔗 Use links instead of repeated entries
Enter an assumption once, then reference it wherever it is needed. If monthly rent is held on an Assumptions sheet, link the forecast to that cell instead of typing the rent in 12 columns.
Repeated hard-coded numbers create silent inconsistencies. A changed interest rate, supplier term, or payroll amount should flow through from one controlled input rather than require a search through the workbook.
🧮 Use practical Excel formulas
Useful formulas include SUM for row totals, IF for conditional payments, SUMIFS for aggregating invoice data by expected payment month, and EOMONTH for date headers. Use XLOOKUP or INDEX/MATCH to retrieve assumptions by category where appropriate.
Avoid formulas that are clever but difficult to inspect. Named ranges or structured table references can improve readability, provided the team understands the convention.
🧱 Keep assumptions visible and controlled
Maintain an assumptions register with a description, owner, value, effective date, and source or rationale. Examples include collection timing, price changes, planned hiring dates, and expected financing.
Visually distinguish input cells from formula cells using consistent formatting. Sheet protection can reduce accidental edits, but it should not prevent authorized users from updating assumptions through a clear process.
🔄 Make the forecast genuinely rolling
At each update, replace the completed forecast month with actual cash movement. Investigate meaningful differences, move the horizon forward one month, and add a new twelfth-month forecast based on the latest assumptions.
Do not merely shift columns and retain outdated estimates. The value of a rolling forecast comes from re-estimating future cash based on what has actually happened and what is now known.
📊 Compare forecast, actual, and prior forecast
Track at least three views: actual results, the most recent forecast, and the prior forecast. The comparison reveals whether the business missed expectations because receipts were delayed, costs increased, timing changed, or an assumption was incomplete.
Focus variance review on material lines. A small difference in office supplies may not matter, while a delayed customer receipt or unplanned inventory purchase can change funding decisions.
🚦 Add cash thresholds and visual alerts
Set a minimum cash threshold based on operating needs, bank requirements, or management policy. Use conditional formatting to flag closing balances below that level, and consider a second warning level for balances approaching it.
A chart of monthly closing cash can make a developing squeeze immediately understandable to non-finance stakeholders. Still, the chart is a communication layer; the detailed schedule remains the evidence behind it.
🧪 Build downside and upside scenarios
A single forecast is a central estimate, not a promise. Create scenarios by changing a limited number of meaningful drivers: collection delays, lower sales, higher input costs, postponed capex, or a delayed financing event.
Keep scenarios internally consistent. If sales fall, related variable purchases may also fall, while fixed payroll and rent may not. A scenario that changes only receipts can be useful for a stress test, but label what it is testing.
🧯 Plan actions for a projected shortfall
A forecast has little value if a projected cash deficit produces no response. Potential actions may include accelerating collections, rescheduling discretionary expenditure, negotiating supplier timing, drawing an approved facility, or revising an investment plan.
Each action has trade-offs. Paying suppliers later may preserve cash but damage relationships or trigger penalties. Borrowing can bridge a timing gap but adds interest and may have covenants. Record both the action and its cash effect.
🔍 Reconcile the model to accounting records
At every refresh, reconcile opening cash to bank records and compare actual receipts and payments to the general ledger and bank transactions. Reconciliation does not mean every forecast line must equal an accounting account; it means differences are understood.
Also check that the prior period’s forecast closing cash agrees with the next period’s opening cash, except for clearly documented changes such as newly discovered bank fees or corrections.
🛑 Avoid common spreadsheet mistakes
- Double-counting: including an invoice in both a collection schedule and a manual receipt line.
- Confusing gross and net amounts: forecasting tax-inclusive supplier payments but comparing them with tax-exclusive budgets.
- Ignoring timing: spreading annual payments evenly across months when the bank pays them in one month.
- Overwriting formulas: replacing a linked calculation with a one-off number to “fix” a result.
- Missing financing assumptions: showing a loan drawdown before approval is sufficiently likely.
Simple controls—formula checks, protected calculation cells, and documented assumptions—address many of these risks.
👥 Assign ownership and a review rhythm
Cash forecasting is cross-functional. Finance may own the workbook, but sales teams know collection risk, procurement knows upcoming commitments, HR knows hiring plans, and operations knows production or inventory needs.
Set a regular update cadence and name owners for key inputs. A short review meeting focused on changes, exceptions, and decisions is often more useful than a long meeting that reads every line of the forecast.
📏 Match the model’s precision to its uncertainty
Displaying cents or overly detailed decimals can imply a level of accuracy the forecast does not possess. Round presentation to an appropriate unit, while keeping underlying calculations precise enough for reconciliation.
More detailed models are not always better. Detail adds maintenance effort and can obscure the main drivers. Add granularity when it changes a decision, improves accountability, or materially improves the timing estimate.
🔐 Protect data quality and version control
Use a clear file naming convention, retain prior forecast versions, and record the date each forecast was issued. For collaborative workbooks, store the file in an approved shared location with appropriate access controls.
Version history matters because management may ask why the expected August closing balance changed. A saved prior version and an assumptions log provide a defensible answer without relying on memory.
✅ Use a final monthly review checklist
Before issuing the forecast, check the basics:
- Opening cash agrees to a reconciled bank balance.
- All 12 month headers are valid dates and the horizon is continuous.
- Closing cash rolls into the following month’s opening cash.
- Material receivables and payables have current expected payment dates.
- Payroll, tax, debt, and capex schedules are included.
- Assumptions and scenario changes are documented.
- Low-cash periods have an identified management response.
🌟 The core principle: forecast timing, then act early
The best rolling cash-flow forecast is not the most elaborate spreadsheet. It is a disciplined view of when cash is expected to move, built from current evidence, challenged by the people closest to operations, and updated when reality changes.
Use detailed schedules for material items, transparent assumptions for uncertain ones, and clear alerts for potential shortfalls. That combination turns Excel from a record of hoped-for numbers into a practical tool for protecting liquidity.
A rolling 12-month cash-flow forecast works when it connects the bank balance of today to the decisions that must be made before tomorrow’s obligations arrive. 📈 💼 🔄