
Most people do not struggle to find their bank balance. They struggle to explain where the balance went.
A few card transactions, a recurring subscription, a cash purchase, and an unexpected bill can turn a seemingly comfortable month into a tight one. By the time you open a spreadsheet, the useful question is no longer “What did I spend?” but “What can I safely spend next?”
A well-designed Excel workbook can answer both questions without becoming another chore. The goal is not to build a miniature accounting system for its own sake; it is to create a reliable routine that turns transactions into decisions.
This project combines an automated expense tracker with a cash-flow dashboard. It works for a student managing rent and part-time income, a household coordinating bills, or a professional who wants clearer visibility before payday.
🧭 Start with the decision your workbook should support
Before choosing colors or formulas, define the decisions the workbook must make easier. A personal tracker normally needs to show spending by category, income received, upcoming obligations, and available cash.
That focus prevents a common spreadsheet problem: collecting many fields that never affect an action. If you will not use merchant location, card last four digits, or receipt image references, leave them out for now.
Good design begins with a question: “What will I change after seeing this number?” For example, a dining-out total may guide next week’s choices, while a projected month-end balance may tell you whether to delay a discretionary purchase.
🧱 Plan a simple workbook architecture
Create separate sheets for distinct jobs rather than placing every element on one large tab. A practical starting structure has four sheets:
- Transactions: the single source of detailed income and expense records.
- Lists: categories, accounts, payment methods, and budget settings.
- Budget: monthly category limits and planned income.
- Dashboard: summaries, charts, and cash-flow indicators.
You may later add an Import sheet for bank downloads or a Bills sheet for scheduled payments. Separation matters because raw data needs frequent updating, while formulas and dashboards should remain stable.
📋 Design the transaction table first
Your Transactions sheet is the foundation. Each row should represent one economic event: one grocery purchase, one paycheck, one refund, or one transfer.
Use columns that answer when, what, where, how much, and how it should be classified:
| Column | Purpose | Example |
|---|---|---|
| Date | When cash moved | 2025-04-03 |
| Description | Merchant or plain-language note | Neighborhood Market |
| Type | Income, Expense, or Transfer | Expense |
| Category | Spending or income grouping | Groceries |
| Account | Cash, checking, credit card, and so on | Checking |
| Amount | Signed monetary value | -54.28 |
| Month | Formula-based reporting period | 2025-04-01 |
Convert this range to an Excel Table with Ctrl+T and give it a meaningful name such as tblTransactions. Tables expand automatically, preserve formulas in new rows, and make formulas easier to read.
➕ Choose a consistent sign convention
Store income as positive amounts and expenses as negative amounts. A grocery purchase becomes -54.28; a paycheck becomes 1850.00.
This convention makes net cash flow straightforward: it is simply the sum of amounts. It also avoids fragile formulas that must subtract one filtered total from another.
Transfers require care. Moving $200 from checking to savings is not income or spending for the household as a whole. Record the checking side as -200 and the savings side as 200, both with Type set to Transfer. Their combined effect is zero.
🏷️ Build categories that lead to action
Categories should be specific enough to reveal patterns but broad enough to use consistently. Ten to fifteen expense categories are usually more useful than a complicated list of fifty.
A balanced set might include housing, utilities, groceries, dining out, transport, insurance, debt payments, health, education, entertainment, shopping, gifts, and savings. Keep income categories separate, such as salary, freelance income, interest, or reimbursements.
Do not confuse a merchant with a category. A supermarket can contain groceries, household supplies, and a gift card. Categorize based on the purpose of the purchase when the difference matters to your plan.
🔽 Use data validation to reduce entry errors
Manual typing causes small inconsistencies that become large reporting problems. “Grocery,” “groceries,” and “Groceries ” may look similar but can appear as separate items in a PivotTable.
On the Lists sheet, create clean vertical lists for Type, Category, Account, and Payment Method. Then use Data Validation in the Transactions table to create drop-down selections.
Allow a temporary category such as Review for transactions you cannot classify immediately. It is better to flag uncertainty than to force a misleading category just to complete the row.
📅 Create a reliable reporting month
Do not derive monthly reports from typed labels such as “April 2025.” Text labels sort poorly and introduce spelling variations. Instead, calculate the first day of each transaction’s month.
=DATE(YEAR([@Date]),MONTH([@Date]),1)Format the result as mmm yyyy. The stored value remains a real date, so formulas can compare it accurately and charts sort it chronologically.
If your pay cycle does not match calendar months, you can build a separate pay-period field later. Begin with calendar months unless your decisions genuinely depend on another cycle.
🧹 Clean bank exports before trusting them
Bank and card exports can save time, but they are not automatically analysis-ready. They may use separate debit and credit columns, unclear merchant descriptions, or dates that represent posting rather than purchase.
Copy imported data into an Import sheet rather than pasting directly into your primary table. Standardize date formats, remove blank rows, inspect negative signs, and map the exported fields to your transaction columns.
Always look for duplicates when downloads overlap. A transaction appearing twice can make a budget look worse than reality, while a missing transaction creates false confidence.
🔁 Decide what “automated” means in your routine
Automation is not one feature. It is a chain: transactions enter in a consistent form, categories are selected from controlled lists, formulas extend automatically, and summaries refresh from the table.
For a simple workbook, adding transactions once or twice a week may be the best trade-off. More advanced users can use Power Query to import and transform downloaded CSV files, but that adds setup and maintenance.
The best automation is the one you will continue to operate. A partly automated workbook reviewed every Friday is more useful than an elaborate system abandoned after two months.
🧮 Calculate core totals with SUMIFS
SUMIFS adds amounts that meet several conditions. It is ideal for fixed dashboard cells because it is transparent and easy to audit.
Assume cell B2 on the Dashboard contains the selected month. This formula returns total expenses for that month, displayed as a positive number:
=-SUMIFS(tblTransactions[Amount],tblTransactions[Month],$B$2,tblTransactions[Type],"Expense")For income, remove the leading minus sign. For net cash flow, sum all non-transfer activity or simply sum the Amount column if transfers are consistently recorded in pairs.
📊 Use PivotTables for flexible exploration
Formulas are excellent for headline metrics, while PivotTables are better for questions you did not anticipate. Create a PivotTable from tblTransactions, place Category in Rows, Month in Columns or Filters, and Amount in Values.
Filter Type to Expense and change the value display if you prefer positive expense totals. Add a slicer for Account, Category, or Month to make the report easier to explore.
PivotTables must be refreshed after new transactions are added. Build that refresh step into your weekly routine, and do not assume an attractive chart is current merely because the source table has new rows.
💵 Distinguish profit-like spending views from cash flow
An expense tracker often focuses on what you consumed, but cash flow asks when money actually enters or leaves an account. Those views can differ.
For example, a credit card purchase may be categorized on its purchase date to show spending behavior, while the card payment affects checking-account cash later. Recording both as expenses would double-count the purchase.
Choose one method and document it. A straightforward personal approach is to record card purchases as expenses when purchased and categorize the later card payment as a transfer from checking to the card account.
🏦 Track accounts when cash timing matters
A combined household total is useful, but it cannot tell you whether your checking account will cover tomorrow’s automatic payment. Add Account to every transaction when managing more than one account.
You can calculate a simplified account balance with an opening balance plus all amounts assigned to that account. For a credit card, use a sign convention that makes its balance meaningful to you, but stay consistent.
Account tracking also exposes a subtle risk: you may have enough total money across savings and checking while still lacking immediately available funds. Cash-flow planning is about both amount and timing.
🧾 Add a bills schedule for predictable outflows
Transaction history explains what happened. A Bills sheet helps you prepare for what is likely to happen next.
Include bill name, due date, expected amount, account paid from, frequency, and whether the amount is fixed or variable. Examples include rent, insurance, phone service, loan payments, and subscriptions.
Expected bills are forecasts, not posted transactions. Keep them separate from actual data so you do not accidentally count them twice. Once paid, the actual transaction belongs in the Transactions table.
🔮 Build a short cash-flow forecast
A practical forecast does not need perfect prediction. It needs to identify periods where committed outflows could exceed available cash.
Start with the current checking balance. Add expected income by date, subtract scheduled bills, and reserve a reasonable estimate for variable essentials such as groceries and transport. Review the next two to four weeks, especially around major due dates.
Suppose checking holds $900, a $1,200 paycheck is expected next Friday, and rent of $1,500 is due before then. The overall monthly income may be adequate, but the timing creates a gap. That is the kind of problem a cash-flow view is designed to reveal.
🧱 Set budgets as guardrails, not verdicts
A budget is a planned allocation, not a moral scorecard. It should reflect fixed commitments, financial priorities, and realistic variable spending.
On the Budget sheet, create columns for Month, Category, Budget Amount, and Notes. Use the same category names as your transaction table. A budget that uses “Food” while transactions use “Groceries” and “Dining Out” will require messy adjustments.
Some categories should be monthly; others may make more sense as annual or irregular reserves. Car maintenance, gifts, and insurance premiums are often easier to manage by setting aside a monthly amount than by treating every payment as a surprise.
🚦 Calculate budget variance clearly
Variance compares what you planned with what actually occurred. For expenses, show actual spending as a positive number and calculate:
=BudgetAmount-ActualSpendingA positive variance means spending is below budget; a negative variance means spending exceeds it. Label the columns plainly so no one has to remember which direction is favorable.
Variance is a signal, not automatic proof of a problem. A medical expense above budget may be necessary, while an underspent category may simply reflect a delayed bill. Read the number in context.
🎨 Use conditional formatting with restraint
Conditional formatting can make exceptions visible quickly. Apply an amber or red fill when expense variance is negative, and use a neutral or green indicator when planned spending remains available.
Use it for a few meaningful conditions: overdue bills, uncategorized transactions, negative projected checking balance, or budget overruns. If nearly every cell has an alert color, the dashboard becomes visual noise.
A useful rule is that color should answer “What needs attention?” rather than decorate the workbook.
📈 Choose dashboard metrics that change behavior
A dashboard should summarize, not reproduce the transaction sheet. Start with a small group of measures:
- Total income this month
- Total expenses this month
- Net cash flow
- Current or projected available checking cash
- Budget remaining in key variable categories
- Largest expense categories
Place the selected month in one obvious input cell and link your dashboard formulas, PivotTables, and charts to the same reporting period where possible. Multiple date controls create confusion.
📉 Pick charts that answer a specific question
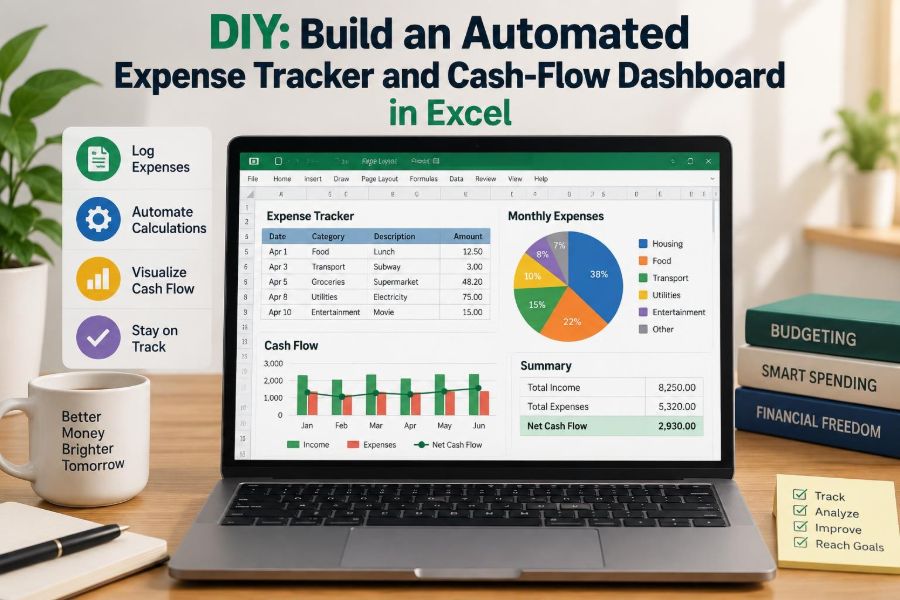
Use a clustered bar chart to compare spending categories against budget. Use a line chart to show monthly net cash flow over time. Use a simple column chart to show income versus expenses across recent months.
Pie charts can work for a small number of categories, but they make similar-sized values hard to compare. Avoid 3D charts, excessive legends, and charts with more categories than a reader can interpret in a few seconds.
Every chart deserves a title that states its purpose, such as “April Spending by Category,” rather than a generic title like “Chart 1.”
🪜 Build the dashboard in layers
Arrange the dashboard from high-level status to supporting detail. The top row can contain four prominent figures: income, expenses, net cash flow, and projected checking balance.
Below that, show a budget-versus-actual comparison and a category breakdown. Put diagnostic details, such as uncategorized transactions or upcoming bills, lower on the page where they remain available without competing with the headline story.
This layout mirrors a good management review: first identify the result, then locate the driver, then inspect the underlying transactions if needed.
🔍 Reconcile before you rely on the dashboard
Reconciliation means comparing your records with an independent source, usually a bank or card statement. It is how you find missing entries, duplicate imports, incorrect amounts, and transactions assigned to the wrong account.
At least monthly, compare the ending balance in your account records with the statement balance after accounting for pending items. Investigate differences rather than adjusting a number to make it look right.
For cash transactions, reconciliation may be less exact. In that case, use a small cash-on-hand count and accept that minor timing differences can occur, while still investigating large or recurring gaps.
🧷 Handle refunds, reimbursements, and shared costs
Refunds should usually reverse the original category. A grocery refund recorded as grocery income would inflate income and make food spending look higher than it really was.
For a reimbursement, decide whether it is repayment for an expense or genuine income. If you paid $60 for a shared dinner and a friend repays $30, recording a $30 offset in Dining Out may better show your personal cost than treating the repayment as income.
Keep a note when a transaction has an unusual treatment. Clear documentation is especially valuable when you revisit the workbook months later.
🛑 Avoid double-counting transfers and card payments
Double-counting is one of the most damaging errors in personal trackers because totals still appear plausible. It often occurs when card purchases are recorded as expenses and the later card payment is also categorized as an expense.
Likewise, moving money to savings should not reduce household net worth or appear as consumption. It is a location change, not spending.
Set Type to Transfer for both sides of an internal movement and exclude transfers from expense charts and budgets. A short rule written on the Lists sheet can prevent repeated mistakes.
🧯 Protect the workbook from accidental damage
Keep formulas in calculated columns and avoid typing over them. Lock formula cells if multiple people edit the file, but remember that worksheet protection is mainly a safeguard against accidental changes, not strong security.
Save a dated backup before making major structural changes. If the workbook contains sensitive financial data, use a secure storage location, limit sharing, and consider device-level protections.
Do not place account numbers, passwords, or banking credentials in the workbook. A tracker needs transaction information, not access secrets.
🧪 Test formulas with known examples
Before using the dashboard for real decisions, enter a small hypothetical data set and calculate the expected result by hand. For instance, enter $1,000 of income, $250 of groceries, and $100 of transport. Net cash flow should be $650.
Then test edge cases: a refund, a transfer between accounts, a transaction on the first day of a new month, and a blank category. Testing reveals logic problems while the workbook is still easy to revise.
When a result looks wrong, check the source rows before changing the formula. Many “formula errors” are actually classification or date-entry errors.
⏱️ Establish a low-friction maintenance rhythm
An effective routine is short and repeatable. Once a week, import or enter transactions, categorize the Review items, refresh PivotTables, and scan the cash forecast. Once a month, reconcile accounts, review budget variance, and update upcoming bills.
Schedule the review near a time you naturally handle money, such as after payday or before planning the week’s purchases. Consistency matters more than daily perfection.
If you miss a week, do not rebuild the workbook from scratch. Catch up from bank exports, reconcile, and resume the routine.
🧠 Learn from trends instead of judging one month
One month can be unusual because of travel, annual fees, repairs, or a timing shift in a bill. Trends across several months are more useful for setting realistic category limits and recognizing recurring pressure points.
Look for questions such as: Which costs are fixed? Which categories rise when work becomes busy? Which subscriptions have lost their value? Are irregular expenses being funded gradually?
The dashboard cannot answer those questions by itself. It gives you a reliable starting point for asking them with evidence rather than memory.
🛠️ Know when Excel is no longer the right tool
Excel is highly capable for personal tracking, especially when you want control over categories, calculations, and presentation. It may become less suitable when several people need simultaneous mobile entry, bank feeds are essential, or transaction volume becomes difficult to review manually.
That does not make the workbook a failure. The structure you built—clean data, controlled categories, reconciliation, and separation of actual versus forecast—transfers to many accounting and finance tools.
Use the tool that supports a dependable process, not the tool with the longest feature list.
✅ The core principle: reliable inputs create useful decisions
An automated expense tracker is not defined by flashy charts or advanced functions. Its value comes from disciplined inputs, a consistent sign convention, clear classifications, and a routine for checking the results.
Build the transaction table first. Add controlled lists and formulas next. Then create a dashboard that highlights the few measures that influence your next decision: what is available, what is committed, and where spending is changing.
Once the system is working, improve it gradually. Add a bill forecast, account-level balances, or Power Query only when each addition solves a real problem rather than adding complexity.
A simple workbook that you update, reconcile, and understand will do more for your cash flow than a sophisticated dashboard you do not trust. Start with one clean month of transactions, let the patterns emerge, and use the results to make the next month more intentional. 💰📊✅