
A sales manager wants next quarter’s hiring plan by Friday. The finance team is also preparing a five-year cash-flow forecast for a lender, a 12-month budget for the board, and a rolling estimate of this month’s profit. All are called forecasts, yet they should not be trusted in the same way.
The farther a forecast looks ahead, the more assumptions it must carry: customer demand, prices, wages, interest rates, supply conditions, competitors, and management decisions. A small error in one assumption can be manageable next month and material three years from now.
That does not make long-range forecasting pointless. It means the job changes with the time horizon. Near-term forecasts can support operational decisions; distant forecasts are often more useful for testing resilience, setting direction, and identifying decisions that would be difficult to reverse.
The practical question is not, “How many years can we forecast?” It is, “What level of accuracy is realistic for the decision being made?” Answering that question helps accountants, analysts, and managers use financial forecasts without mistaking a detailed spreadsheet for certainty.
🧭 The short answer: accuracy usually fades gradually, then visibly
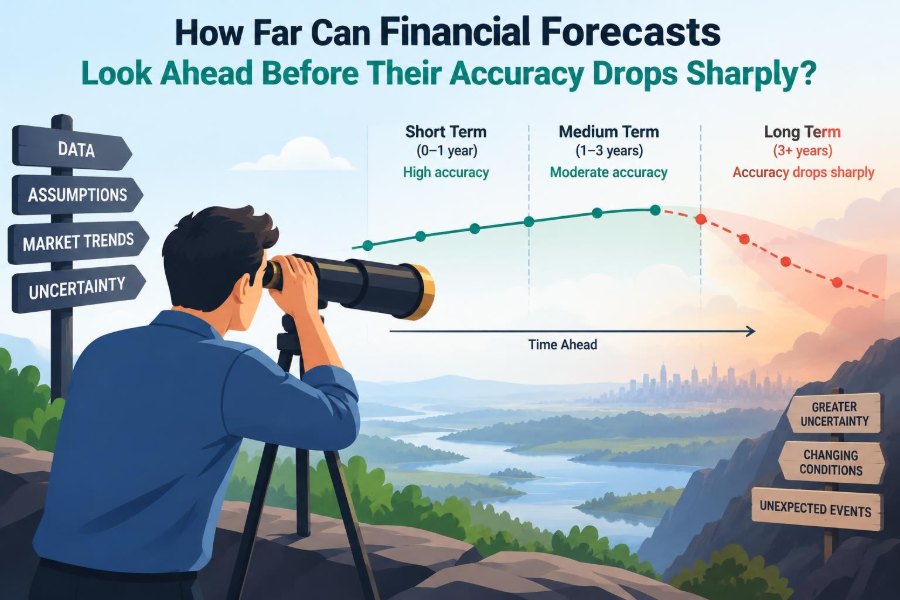
There is no universal point at which forecasts suddenly fail. A grocery retailer with stable weekly sales may estimate the next few weeks reasonably well, while a project-based contractor may face large uncertainty even one quarter ahead.
Still, forecast reliability generally declines as the horizon expands. The decline can feel sharp when assumptions begin to compound, when a business faces a major decision point, or when external conditions change faster than the model can adapt.
Think of a forecast as a cone rather than a line. Near the present, the plausible range is narrow. Farther out, the range widens because more future outcomes remain possible.
📏 Forecast horizon means more than a date on a spreadsheet
A forecast horizon is the period between today and the outcome being estimated. A forecast for next week has a short horizon; a forecast for fiscal year five has a long one.
Horizon length matters, but so does the unit of time. A 12-month forecast prepared monthly may be useful for annual planning. A 12-month forecast broken into daily revenue amounts can create an illusion of precision unless daily patterns are genuinely predictable.
The appropriate horizon depends on the decision. Payroll scheduling, inventory ordering, capital investment, and debt refinancing require different views of the future.
🔍 Precision and usefulness are not the same thing
A long-term forecast can be inaccurate in its exact numbers and still be useful. For example, a manufacturer considering a new plant may not know its revenue in year seven, but it can still assess whether the project remains viable under lower demand, higher input costs, or delayed construction.
Exactness is not the only standard. A forecast may be useful if it correctly indicates the direction of cash pressure, the approximate funding need, or the conditions under which a strategy stops making economic sense.
This distinction prevents a common mistake: rejecting every uncertain forecast instead of matching its use to its reliability.
🗺️ Different decisions require different look-ahead periods
| Decision | Typical useful horizon | Primary forecasting purpose |
|---|---|---|
| Staff scheduling and purchasing | Days to weeks | Operational control |
| Cash management and working capital | Weeks to months | Liquidity protection |
| Budgeting and performance management | Months to one year | Resource allocation |
| Financing and investment appraisal | Several years | Scenario testing and valuation |
| Strategy and market positioning | Several years and beyond | Direction, options, and resilience |
These ranges are not rules. They show why one organization may legitimately maintain several forecasts at once. Trying to make a single model answer every question usually produces either too little detail for operations or too much false detail for strategy.
⏱️ The near term benefits from information already in motion
Short-horizon forecasts often draw on facts that have already begun to develop: orders received, contracts signed, shipments scheduled, staff rosters, accounts receivable due dates, and known price changes.
For a business that invoices customers after delivery, the next few weeks of collections may be estimated from an aged receivables report. Some customers may still pay late, but the forecast rests on observable obligations rather than broad economic assumptions.
That informational advantage is why daily or weekly cash forecasting can be highly valuable, even though it still requires judgment.
🌱 The medium term depends on business drivers
As the horizon moves from weeks to months, the forecast becomes more dependent on drivers: the underlying factors that generate financial results. Examples include sales volume, conversion rate, average selling price, headcount, labor utilization, and material costs.
A retailer may forecast revenue from expected foot traffic, online conversion, units per transaction, and average order value. A consulting firm may begin with available billable staff, expected utilization, billing rates, and pipeline conversion.
Driver-based forecasting is stronger than simply extending last year’s totals because it exposes the assumptions that management can challenge and monitor.
🏗️ The long term becomes a model of assumptions
Beyond the medium term, a forecast is less a prediction of specific results and more a structured representation of assumptions. Customer behavior may change, products may be replaced, and management may pursue plans that do not yet exist in operational detail.
This is normal. The problem arises when a five-year forecast is presented with the same confidence as a monthly cash forecast. Long-term estimates should be explained as scenarios, ranges, and decision tools rather than promised outcomes.
Detailed formulas do not remove this uncertainty. They merely show how the model translates assumptions into numbers.
📈 Compounding turns small errors into large gaps
Suppose a hypothetical company expects revenue to grow modestly each year. If actual growth is slightly below the assumed rate for several consecutive years, the year-five revenue gap can be much larger than the first-year gap.
Costs can compound too. A persistent difference in wage inflation, borrowing rates, customer churn, or raw-material prices may substantially alter cash flow over time. When one forecast output feeds the next period’s starting point, errors accumulate.
This is why a long-range model should emphasize key sensitivities instead of treating every annual cell as equally credible.
🔗 Interconnected assumptions amplify uncertainty
Forecast assumptions rarely move independently. A price increase may reduce volume. Faster growth may require more inventory and hiring. Higher interest rates may raise finance costs and reduce customer demand at the same time.
A weak model changes one variable while assuming everything else remains fixed, even when the variables are economically connected. That can understate downside risk.
Good forecasting asks, “If this changes, what else is likely to change?” It does not require perfect answers; it requires a plausible view of the relationships.
🌦️ External shocks are hardest to time
Economic slowdowns, supply disruptions, regulation, exchange-rate movements, severe weather, and competitive actions can materially affect results. Some risks can be identified in advance, but their timing, scale, and duration are often uncertain.
Forecasts should not pretend to know when an unknown event will occur. Instead, risk-aware models can test what happens if demand falls, a supplier fails, costs rise quickly, or financing becomes less available.
The objective is preparedness, not clairvoyance.
🏢 Business stability sets the practical forecasting limit
Stable businesses can often forecast farther ahead than volatile ones. Recurring contractual revenue, diversified customers, predictable renewal patterns, and mature products tend to provide a firmer base than one-off sales or rapidly changing markets.
However, stability can be overstated. A company with recurring revenue may still have concentration risk if a few customers represent a large share of sales. A regulated utility may have steadier demand but remain exposed to policy and capital-cost changes.
Assess the stability of the actual revenue and cost drivers, not just the industry label.
🧾 Revenue quality matters more than the revenue total
Forecasted sales deserve different levels of confidence depending on their source. Signed orders, contracted subscriptions, qualified pipeline opportunities, and speculative leads should not be treated alike.
A useful approach is to separate revenue into categories such as committed, highly probable, pipeline-based, and unqualified opportunity. Each category can use a different conversion assumption.
This produces a more honest forecast than entering the full sales pipeline as expected revenue. It also helps commercial teams see whether future targets rest on contracts or hopes.
💸 Cash forecasts may diverge from profit forecasts
Profit forecasts estimate earned revenue and incurred expenses under accounting rules. Cash forecasts estimate when money will actually enter and leave the bank. The two are related but can diverge sharply.
A growing company can report profit while facing a cash shortage because it must fund inventory, pay staff, or wait for customers to settle invoices. Conversely, customer deposits can improve cash before the related revenue is recognized.
For solvency and liquidity decisions, a short-term cash forecast is often more urgent than a long-term profit projection.
🧮 Granularity can create false confidence
Managers sometimes request a forecast with many decimal places, monthly detail for ten years, or a precise number for every small cost category. Detail can be useful, but only when it reflects real information.
A model that predicts year-eight office supplies to the nearest currency unit is not more reliable than one that uses a sensible annual assumption. It is simply more elaborate.
Use detail where decisions need it and aggregate where uncertainty dominates. This frees time for testing important assumptions instead of maintaining decorative precision.
🎯 Forecasts should begin with the decision
Before building a model, state what decision it will support. Is the organization deciding whether to hire, whether it can meet debt payments, whether to approve a capital project, or whether to enter a new market?
The decision determines the horizon, level of detail, and error tolerance. A hiring decision may need a credible three-month demand outlook. A long-lived investment needs several years of scenarios, including a downside case.
Starting with a decision also prevents “forecasting for reporting’s sake,” where numbers are produced without a clear action attached to them.
🧱 Build from observable drivers, not top-line guesses
A practical driver-based model often begins with a small number of operational measures. For example, a café might forecast transactions, average transaction value, opening days, staffing hours, food cost percentage, and rent.
These measures are not guaranteed to remain stable, but they are easier to understand and challenge than an unsupported revenue total. They also create a direct link between operations and finance.
Where data is limited, keep the model simple. A transparent model with a few defensible drivers is usually preferable to a complex model built on weak inputs.
🔄 Use rolling forecasts to reduce the distance
A rolling forecast is updated regularly and always extends a fixed distance into the future, such as 12 or 18 months. When one month ends, another future month is added.
This approach does not eliminate uncertainty, but it prevents an annual budget from becoming stale. New actual results replace old estimates, and assumptions can be revised before they create a large planning gap.
Rolling forecasts work best when updates focus on meaningful changes rather than forcing every manager to rebuild every line item from scratch.
📊 Compare forecast versions instead of overwriting history
Keep a record of what was forecast, when it was forecast, and what assumptions were used. Without this history, teams cannot tell whether outcomes changed because the model was weak, conditions changed, or the business made a different decision.
Version comparison also reveals where uncertainty emerges. If revenue estimates repeatedly decline as a quarter progresses, the pipeline conversion assumptions may be too optimistic. If payroll is consistently underestimated, hiring timing or overtime behavior may be missing from the model.
Forecasting improves through feedback, not through quietly replacing old numbers.
🧪 Measure error with a useful benchmark
Forecast error is the difference between forecast and actual results. It should be examined in both currency terms and, where appropriate, percentage terms. A small percentage error on a very large cash balance can still matter; a large percentage error on a tiny expense may not.
Do not judge a forecast only by whether it was exactly right. Ask whether it was accurate enough for the decision. A cash forecast that misses a possible covenant breach is more serious than one that slightly misses a low-value administrative cost.
Review errors by horizon. Forecasts made one month ahead should generally be assessed differently from those made twelve months ahead.
🪞 Bias can be more damaging than random error
Random error moves in both directions. Bias is a consistent tendency to overstate or understate results. A sales forecast that is repeatedly optimistic is not neutral simply because it occasionally comes close.
Common sources include target pressure, anchoring on last year’s budget, reluctance to report bad news, and assumptions that favorable conditions will continue. Cost forecasts can be biased downward when teams omit implementation effort, maintenance, or contingency.
Separate targets from forecasts. A target expresses what the organization wants to achieve; a forecast expresses what is currently expected to happen.
⚖️ Scenarios are better than a single distant number
For longer horizons, build a small set of internally consistent scenarios rather than defending one “most likely” number as if it were certain. A base case might reflect current expectations, while upside and downside cases reflect plausible changes in key drivers.
The cases should not be arbitrary percentage adjustments. If volume falls, explain why; if costs rise, show which costs and why. A scenario is most useful when its assumptions describe a coherent business condition.
Decision-makers can then ask which actions remain sensible across several plausible futures.
🌡️ Sensitivity analysis identifies the assumptions that matter
Sensitivity analysis changes one key assumption to see how much an output changes. For a debt-funded investment, a team might test the effect of lower sales volume, slower collections, higher capital cost, or a delay in opening.
It is particularly helpful when management needs to know the break point: the level of sales, margin, or cash collection required to avoid a loss or funding shortfall.
Not every input deserves the same attention. Focus first on variables that are uncertain and have a large effect on cash flow, profit, or covenant compliance.
🚦 Use trigger points to turn forecasts into action
A forecast becomes more valuable when it includes predefined response points. For example, if cash is expected to fall below a stated minimum, management may accelerate collections, delay discretionary spending, draw an approved facility, or revisit purchasing commitments.
Likewise, a demand forecast that drops below a threshold might trigger a hiring pause rather than an immediate layoff. Triggers make the connection between information and action explicit.
They should be designed carefully. An automatic response can be harmful if it ignores context, so responsible owners should review significant triggers.
🧠 Separate controllable choices from external assumptions
Some forecast inputs are management choices: hiring pace, marketing spend, pricing policy, production capacity, and payment terms. Others are external: market demand, inflation, competitor behavior, and interest rates.
Separating them helps managers see where they can act and where they need contingency plans. It also improves accountability because a missed external assumption should not be discussed in the same way as a delayed internal project.
This distinction is especially helpful in long-range plans, where a model can otherwise hide strategic choices among many economic assumptions.
👥 Cross-functional input improves realism
Finance owns the discipline of the model, but it rarely owns all the information. Sales understands pipeline quality, operations understands capacity constraints, procurement understands supplier conditions, and human resources understands hiring lead times.
Cross-functional forecasting does not mean accepting every departmental estimate without challenge. It means reconciling them. If sales predicts growth, operations should be able to explain how it will be delivered and finance should show the working-capital effect.
A forecast is strongest when its assumptions are both accountable and connected.
🛑 Common warning signs of an overextended forecast
- The model shows highly specific monthly amounts many years ahead without a clear operational basis.
- Revenue grows smoothly while no allowance is made for churn, competition, capacity limits, or market changes.
- All scenarios use the same collections, margins, and financing conditions.
- Forecasts are never compared with actual results or prior versions.
- A budget target is presented as the expected outcome.
- Managers cannot identify the few assumptions that drive most of the result.
These warning signs do not prove that a forecast is wrong. They indicate that its apparent precision may be greater than its evidential foundation.
🧰 A practical horizon framework for finance teams
Many organizations benefit from using several connected planning layers. The exact timing should fit the business cycle, but the logic is widely applicable.
- Near-term cash view: update frequently using bank balances, payment dates, receivables, payroll, and known commitments.
- Operational outlook: project the next several months using orders, capacity, staffing, and driver-based revenue and cost assumptions.
- Rolling financial forecast: maintain a forward view for budgeting, resource allocation, and financing conversations.
- Strategic scenarios: model longer-term alternatives to test investments, capital structure, and strategic flexibility.
Each layer should reconcile broadly with the others, but they should not be forced into identical detail or identical claims of accuracy.
🧩 A hypothetical example: opening a second location
Consider a hypothetical restaurant considering a second site. For the next month, it can forecast cash using lease deposits, construction invoices, payroll, and expected receipts from the existing site. This is a relatively concrete exercise.
For the first year of the new location, it might forecast covers served, average spend, opening date, food costs, staffing, and marketing. Uncertainty is higher because customer adoption and staffing conditions are not yet proven.
For years two through five, the useful question is not whether revenue will equal one exact figure. It is whether the investment can withstand slower ramp-up, lower margins, higher rent escalation, or a need for additional working capital. The forecast has moved from prediction toward decision testing.
📚 When long-range forecasts are still essential
Long-term forecasting remains necessary for capital budgeting, valuations, pension and funding assessments, debt capacity analysis, infrastructure planning, and strategic choices with lasting consequences. Refusing to look ahead does not remove long-term risk.
The discipline is to communicate uncertainty honestly. Use ranges where appropriate, show the assumptions, stress important vulnerabilities, and avoid presenting remote outcomes as settled facts.
A long-range forecast should support better questions: What must be true for this plan to work? What could change that? What options preserve flexibility if it does?
✅ The core principle: confidence should decline as distance increases
Financial forecasts can look ahead for as long as a decision requires, but the language, detail, and controls must change as the horizon lengthens. Near-term estimates can be more specific because they rely on information already underway. Long-term estimates need scenarios, sensitivities, and explicit assumptions.
The most reliable organizations do not seek a permanently accurate number. They build a repeatable process: use observable drivers, update regularly, measure error, challenge bias, and connect forecasts to decisions and trigger points.
Accuracy drops sharply not at one magic date, but when the forecast contains more untested assumptions than decision-relevant evidence. Recognizing that boundary is a core skill in accounting and financial management.
A good forecast is not the one that claims to see furthest; it is the one that gives decision-makers the clearest view of uncertainty, options, and action. 💰📊🧭