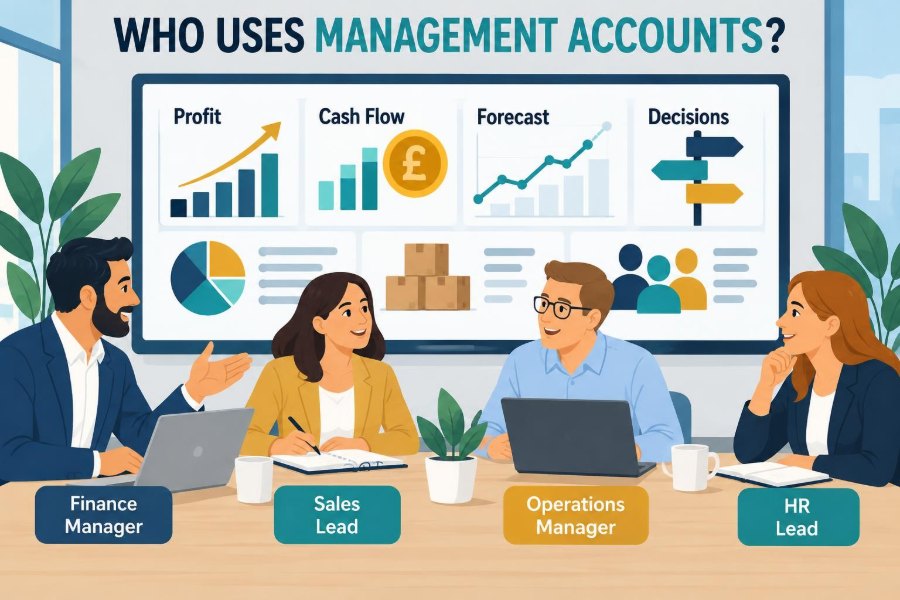

It is Monday morning. Sales has celebrated a strong month, operations is asking for extra staff, and the managing director wants to know why cash still feels tight. Each statement may be true—but each describes only one part of the business.
Annual financial statements will eventually show what happened. They are essential for shareholders, lenders, regulators, and tax authorities. But they are usually too late and too broad to settle this week’s pricing decision, staffing plan, or inventory order.
That is where management accounts come in. They turn recent financial and operational information into a working view of performance: what is changing, why it is changing, and where managers may need to act.
Management accounts are not just “the finance team’s report.” Different teams use the same underlying numbers in different ways. The real value appears when those interpretations lead to coordinated, evidence-based decisions.
🧭 What Management Accounts Are
Management accounts are internal financial reports prepared for people who run an organization. They commonly include a profit and loss account, balance sheet, cash-flow view, budgets, forecasts, and explanations of significant differences from plan.
Unlike statutory accounts, management accounts are designed around management needs rather than a prescribed external reporting format. A restaurant group may track sales by location and labour hours; a software company may focus on recurring revenue, customer acquisition cost, and development spend.
The core question is practical: what does the organization need to know in order to make a better next decision?
📅 Why Timing Changes Their Value
Management accounts are often produced monthly, though faster-moving businesses may review selected measures weekly or even daily. Their usefulness depends on a sensible balance between speed and reliability.
A report delivered three weeks after month-end may still explain performance, but it gives little time to correct it. A report delivered the next morning may be quick but misleading if key invoices, payroll costs, or inventory movements are missing.
Good reporting teams establish a close timetable: clear cut-off dates, defined reconciliations, named owners, and a predictable review cycle. Timeliness makes financial information actionable rather than merely historical.
🏗️ The Difference Between Management and Financial Accounts
Financial accounts primarily communicate with external users. They follow applicable accounting requirements and present the organization as a whole. Management accounts are internal, more flexible, and often more detailed.
| Feature | Management accounts | Financial accounts |
|---|---|---|
| Main audience | Managers and internal teams | Owners, lenders, regulators, and other external users |
| Main purpose | Planning, control, and decisions | Formal reporting and accountability |
| Timing | Often monthly or more frequently | Usually annual, with some interim reporting |
| Level of detail | May show products, sites, customers, or teams | Normally summarizes the entity |
| Format | Adapted to internal questions | More standardized and rule-led |
The two sets of accounts should not contradict each other, but they serve different jobs. A management report may allocate costs to a product line for decision-making even where the statutory statements do not present that product line separately.
🧩 The Core Building Blocks
Most management packs combine several perspectives because no single statement tells the full story. Profit can improve while cash worsens; sales can rise while margins fall.
- Profit and loss: revenue, direct costs, overheads, and profit.
- Balance sheet: assets, liabilities, capital, working capital, and financial position.
- Cash-flow analysis: cash received, cash paid, and expected liquidity.
- Budget and forecast: planned results and the latest expected outcome.
- Operational measures: volumes, hours, leads, delivery times, defects, or capacity.
Connecting financial and operational measures is what lets teams investigate causes rather than simply observe outcomes.
👔 How Senior Leaders Use the Pack
Senior leaders use management accounts to see the organization as a connected system. They are rarely looking only for a single “good” or “bad” number; they need to understand trade-offs across growth, profitability, cash, risk, and capacity.
For example, a chief executive may see revenue ahead of budget but ask whether the increase comes from sustainable customer demand, one-off contracts, or discounting. A finance director may then test whether the additional sales are generating enough cash to fund expansion.
The leadership team uses the pack to prioritize attention. A concise variance explanation can be more decision-useful than a page of figures with no interpretation.
🎯 The Board’s Oversight Role
A board or governing body usually uses management accounts at a higher level than an operating manager. Its role is oversight: challenging performance, approving major investments, monitoring solvency, and testing whether management’s plans remain credible.
Board reporting should distinguish between a temporary fluctuation and a structural issue. One month of low sales after a delayed shipment may call for monitoring. Repeated margin erosion in a major market may require a change in strategy.
Boards also need an honest view of uncertainty. Forecasts are estimates, not promises, and the assumptions behind them deserve scrutiny.
💼 Finance Teams as Stewards and Interpreters
Finance teams prepare, review, and explain management accounts, but their role is broader than assembling spreadsheets. They maintain definitions, reconcile key balances, challenge unusual movements, and help others understand the financial consequences of operational choices.
A good finance business partner might ask why a production department expects overtime to decline, whether a sales forecast includes signed orders or early-stage leads, or whether a proposed saving simply shifts cost into another team.
This is sometimes called management accounting: using accounting information to support planning, control, and decisions inside the organization.
📈 Sales Teams Turn Revenue Into Forecasts
Sales teams use management accounts to compare actual revenue with targets, examine sales by customer or product, and assess the quality of the sales pipeline. A pipeline is a structured view of potential deals at different stages of likelihood.
Revenue alone can mislead. A sales team may exceed a monthly target by offering larger discounts or accepting low-margin work. Management accounts help reveal whether sales growth also produces a commercially worthwhile contribution.
In a hypothetical distributor, a salesperson may report a large order win. Finance can show that the order has an extended payment term and a lower gross margin than normal. The conversation then becomes more complete: not “Did we sell?” but “Was this sale worth the cash and capacity it will consume?”
🏷️ Pricing Decisions Need Cost Context
Pricing teams and commercial managers need to understand the cost structure behind an offer. The relevant cost may include materials, delivery, commissions, payment fees, installation, support, and expected returns—not just the supplier invoice.
Contribution margin is often useful here. It is the amount left from revenue after variable costs, available to cover fixed costs and then profit. It can help evaluate whether a special order adds value when spare capacity exists.
However, contribution is not a universal pricing answer. A price that covers variable cost may still be unsuitable if it damages market positioning, creates a precedent for other customers, or requires new capacity.
⚙️ Operations Use Numbers to Control Delivery
Operations managers translate resources into goods or services. Their management information often combines cost data with measures such as units produced, labour hours, machine uptime, on-time delivery, waste, and rework.
If direct labour cost rises, the cause could be overtime, low productivity, training, a shift in product mix, or an inaccurate standard cost. Each cause calls for a different response.
Finance should not treat operations as a black box, and operations should not view finance as distant scorekeeping. The strongest review meetings connect a variance to the physical process that produced it.
📦 Inventory Is Cash Sitting on a Shelf
Procurement, warehouse, and production teams use management accounts to manage inventory levels and purchasing commitments. Stock protects customer service and production continuity, but excessive stock ties up cash and can become obsolete.
Inventory reports may highlight slow-moving items, stock ageing, purchase price changes, and inventory turns. Inventory turns describe how frequently stock is sold or used over a period; interpretation depends heavily on the business model.
A low stock balance is not automatically efficient. It may signal a risk of missed sales or production stoppages. The right level depends on lead times, demand volatility, service promises, storage costs, and the reliability of suppliers.
🚚 Procurement Looks Beyond the Purchase Price
Procurement teams can use management accounts to compare supplier costs, track purchase price variances, and understand the financial effects of contract terms. The cheapest quoted unit price is not always the lowest total cost.
A supplier with a low price but inconsistent delivery may force expensive emergency purchases, higher safety stock, or interrupted production. Procurement decisions therefore benefit from seeing quality, lead time, payment terms, freight, and risk alongside price.
When finance and procurement share a clear cost model, negotiations can focus on the total commercial outcome rather than a headline discount.
👥 HR Connects People Plans to Affordability
People costs are often among an organization’s largest controllable costs. HR and department leaders use management accounts to plan headcount, review payroll trends, evaluate recruitment timing, and understand the cost of turnover, overtime, contractors, and benefits.
A vacancy can look like a saving in a monthly report, yet it may create hidden pressure through delayed work, overtime, or lost customer service. Conversely, adding employees before revenue materializes can create a fixed cost burden that is difficult to unwind.
Useful headcount reporting links roles and start dates to a forecast, rather than treating payroll as a single unexplained total.
📣 Marketing Measures Economic Outcomes
Marketing teams need financial information to decide which campaigns, channels, and audiences deserve further investment. Leads, impressions, and website visits can be useful indicators, but they are not automatically measures of commercial success.
Management accounts can connect campaign spend with qualified opportunities, conversion, revenue, gross margin, and customer retention where data quality permits. The aim is not to reduce marketing to one simplistic metric; brand-building activity may have longer and less direct effects.
What matters is clarity about the purpose of spend. A short-term lead campaign should be assessed differently from a long-term brand initiative.
🧑💻 Product and Technology Teams Balance Investment
Product and technology teams make choices that can shape costs and revenue for years. Management accounts help distinguish recurring operating costs from longer-term investment and show the affordability of staffing, software subscriptions, infrastructure, and external specialists.
Accounting treatment can be complex. In some circumstances, development expenditure may be capitalized; in others, it is expensed as incurred, depending on the relevant accounting framework and facts. Teams should not treat an accounting classification as proof that a project is economically worthwhile.
The key management question remains: what benefit is expected, when might it arrive, what resources are committed, and what would change if the project were delayed or stopped?
🛠️ Project Managers Track the Economics of Scope
Project managers use management accounts to compare approved budgets with actual spend, committed costs, work completed, and expected cost to finish. This is particularly important for construction, consulting, implementation, and internal transformation projects.
Scope changes can be commercially sensible, but they must be visible. A project may appear under budget only because costs have not yet been invoiced or because future work has been underestimated.
A forward-looking project forecast is more valuable than a simple record of past spending. It should be refreshed when timelines, staffing, supplier prices, or customer requirements change.
🏪 Site Managers Need Local Accountability
Managers of stores, branches, clinics, venues, or regional offices often receive location-level management accounts. These reports may compare sales, labour, rent, waste, local marketing, and other controllable costs against budget and prior periods.
Local reports work best when managers can influence the measures they are judged on. Charging a site for centrally negotiated costs it cannot control may still be necessary for total profitability analysis, but it should be clearly labeled.
This distinction protects accountability. Managers should understand both the full economics of their site and the levers they can realistically pull.
🤝 Customer Service Sees the Cost of Experience
Customer service teams can use management information to connect service levels with financial outcomes. Complaint volumes, response times, refunds, credits, repeat contacts, and churn can indicate whether service problems are creating avoidable cost or revenue loss.
It would be a mistake to pursue the lowest possible cost per contact at the expense of resolution quality. Rapidly closing calls may reduce a dashboard measure while creating repeat work and dissatisfied customers.
Balanced reporting asks whether customers’ issues are resolved, whether failures recur, and what the organization spends to correct preventable problems.
🏦 Treasury Focuses on Cash, Not Just Profit
Treasury responsibilities vary by organization, but the cash question exists everywhere: will the organization have enough money to meet obligations when they fall due? Profit and cash are related, yet they are not the same.
A profitable business can face pressure if customers pay late, stock grows, or it makes large capital purchases. A cash forecast therefore estimates expected receipts and payments by period, using realistic assumptions about collection, payroll, tax, debt, and supplier terms.
Cash forecasting is inherently uncertain. Its value comes from identifying timing risks early enough to manage them, not from pretending to know the future exactly.
🧾 Working Capital Links Departments Together
Working capital broadly refers to short-term operating assets and liabilities, especially receivables, inventory, and payables. It is one of the clearest examples of why teams cannot make financial decisions in isolation.
Sales can improve receivables by securing deposits or worsen them by agreeing long payment terms. Operations can lower inventory but harm availability. Procurement can preserve cash by extending supplier terms but potentially strain supplier relationships.
Management accounts make these trade-offs visible. The objective is not to minimize every balance independently; it is to support healthy operations while managing liquidity responsibly.
🔍 Variance Analysis Turns Results Into Questions
A variance is the difference between an actual result and a comparison point, such as budget, forecast, prior month, or prior year. Variance analysis asks what caused that difference and whether action is needed.
Useful explanations are specific. “Costs were over budget” is a description, not an explanation. “Freight costs exceeded budget because customer orders shifted toward smaller, urgent deliveries” identifies a driver that managers can investigate.
A strong variance commentary usually covers:
- the size and direction of the movement;
- the operational or commercial cause;
- whether the effect is one-off, timing-related, or ongoing; and
- the proposed owner and next action.
🔮 Budgets Set a Direction, Forecasts Update It
A budget is a plan, often approved before the financial year begins. It allocates resources and creates a reference point for accountability. A forecast is an updated estimate of where the organization now expects to finish.
Confusing the two creates unhelpful behavior. Teams may defend an outdated budget assumption rather than acknowledge changed demand, costs, or capacity. A forecast should reflect the best current view, even when that view is uncomfortable.
Many organizations also use scenarios: for example, a base case, an upside case, and a downside case. Scenarios expose the assumptions that matter most and help leaders prepare contingent actions.
🧪 Assumptions Deserve a Visible Audit Trail
Every forecast rests on assumptions: sales conversion, price, volume, wage rates, collection timing, supplier costs, recruitment dates, and many others. Hiding these inside formulas makes a report difficult to challenge.
A practical forecast identifies its major assumptions, their owners, and the evidence supporting them. If a sales forecast depends on a customer signing by a certain date, that dependency should be visible.
This does not eliminate judgement. It makes judgement discussable, testable, and easier to revise when facts change.
🗂️ Cost Centres and Profit Centres Clarify Ownership
A cost centre is a department, function, or area for which costs are collected, such as IT, finance, or a warehouse. A profit centre is an area measured on both revenue and costs, such as a product division or retail location.
These structures help assign responsibility, but design matters. An overly detailed chart of accounts can burden users with maintenance and produce reports nobody reads. A structure that is too broad hides meaningful differences.
The best design mirrors how decisions are actually made. If managers choose resources by region, product, and channel, reporting may need those dimensions—provided the data can be maintained reliably.
⚖️ Allocating Shared Costs Requires Care
Some costs support many parts of an organization: rent, senior leadership, technology platforms, human resources, and finance. Allocations distribute these shared costs to products, sites, or departments using a chosen basis, such as headcount, floor area, usage, or revenue.
Allocations can help show full profitability, but they are estimates rather than direct facts. A product may look unprofitable after absorbing a large central allocation even though stopping it would not remove that central cost.
For decisions, managers often need to see both views: direct contribution and profitability after a reasonable share of common costs.
📊 Dashboards Should Lead to a Conversation
A dashboard summarizes key measures visually or in a compact format. It can make patterns easier to spot, especially when users need to compare periods, locations, or categories quickly.
But colour coding is not analysis. A red indicator tells a manager to ask a question; it does not explain whether the issue is data timing, a one-off event, poor execution, or a flawed target.
Keep dashboards focused. A smaller set of defined measures, supported by drill-down detail and commentary, is usually more useful than a crowded screen full of unrelated indicators.
🧼 Data Quality Is a Management Issue
Management accounts are only as dependable as the underlying records and processes. Missing purchase orders, inconsistent customer codes, late timesheets, duplicate data, or unclear revenue cut-offs can distort decisions.
Finance cannot solve every data problem alone. Sales owns the quality of pipeline information, operations owns production records, HR owns employee data, and system owners maintain controls over master data and interfaces.
When a figure is uncertain, report that uncertainty honestly. A clearly qualified estimate is safer than a precise-looking number with no sound basis.
🚫 Common Ways Teams Misread the Numbers
One common mistake is treating a favorable variance as automatically good. Spending below budget may result from postponed maintenance, unfilled roles, or missed marketing activity that creates future problems.
Another is comparing unlike periods without context. Seasonality, calendar days, product mix, acquisitions, price changes, and accounting adjustments can all make a simple month-to-month comparison misleading.
- Do not confuse revenue growth with profit growth.
- Do not confuse profit with available cash.
- Do not reward a local metric that harms the wider business.
- Do not treat a forecast as a commitment that cannot be revised.
- Do not act on an unexplained number before checking its source.
🗣️ A Better Monthly Performance Meeting
The management accounts meeting should not become a ritual where finance reads figures aloud and operational leaders defend them. It should concentrate on material movements, decisions needed, risks, and actions.
A useful sequence is to review safety or service constraints where relevant, examine results against forecast, identify drivers, assess cash and capacity implications, and agree named actions with dates. The pack should be circulated early enough for participants to prepare.
The right tone matters. Constructive challenge improves forecasts and controls; blame encourages people to hide bad news until it becomes harder to solve.
🔐 Confidentiality and Appropriate Access
Management accounts can contain sensitive information about pay, pricing, customers, financing, and commercial plans. Not every detail should be available to every employee.
Access should reflect a genuine business need, while still giving decision-makers enough information to act. A site manager may need labour cost and margin information without seeing individual salaries; a board may need a fuller view of financing and legal risks.
Clear access rules, secure systems, and careful distribution protect both people and the organization. Confidentiality should not become an excuse to withhold essential context from accountable managers.
🌱 Building Financial Literacy Across the Business
Non-finance managers do not need to become accountants, but they should understand the measures they influence. Short training on margin, cash, budgets, accruals, working capital, and variance analysis can make reporting far more useful.
Finance teams can help by avoiding unexplained jargon and using real decisions as teaching examples. Explaining why an invoice appears in one month while cash arrives in another is often more memorable than a technical lecture on accrual accounting.
Financial literacy is not about turning every manager into a controller. It is about giving people enough understanding to recognize trade-offs and ask sharper questions.
🧠 The Core Principle: Shared Facts, Better Decisions
Management accounts serve many users because organizations make many kinds of decisions. Sales needs to understand margin and collections; operations needs to understand cost and capacity; leaders need to weigh strategy, risk, profit, and cash together.
The same report will not answer every question, so reports should be tailored without creating competing versions of reality. Common definitions, reconciled data, transparent assumptions, and relevant detail allow teams to interpret the numbers from their own perspective while staying aligned.
Ultimately, management accounts are valuable when they change the quality of a conversation: from opinion to evidence, from surprise to early warning, and from isolated targets to coordinated action.
The best management accounts do not merely report performance—they help every team understand how its decisions shape the whole organization. When numbers are timely, trusted, and connected to real operations, they become a practical tool for better judgement. 📊🤝💡