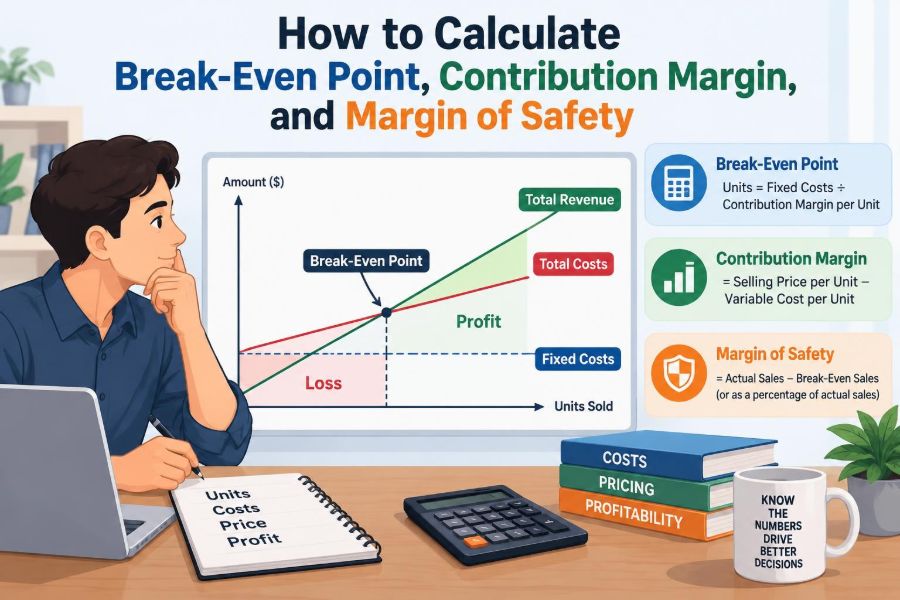

A coffee shop owner knows the rent, payroll, beans, cups, and utilities must be paid whether the morning is busy or quiet. But a full counter does not automatically mean the business is making money. The owner needs to know how many drinks must be sold before sales cover every cost.
The same question appears in a freelance practice deciding whether to accept a contract, a manufacturer considering a new product, and a student analyzing a business case. Revenue matters, but the relationship between revenue, costs, and sales volume matters even more.
Break-even point, contribution margin, and margin of safety turn that relationship into useful numbers. They help managers estimate the sales needed to avoid a loss, understand what each sale contributes, and judge how much room exists before profits disappear.
These tools are deliberately simplified models. Used carefully, they support planning and decisions; used mechanically, they can create false confidence. Start by understanding the cost behavior behind the formulas.
🧭 The question break-even analysis answers
Break-even analysis asks at what level of sales total revenue equals total costs. At that point, profit is zero: the business has not made a profit, but it has not incurred a loss.
It does not answer every financial question. It does not directly measure cash availability, long-term market demand, or product quality. Instead, it provides a clear operating threshold: how much must be sold for the activity to pay for itself?
🧱 Start by separating fixed and variable costs
The analysis depends on classifying costs by how they behave as activity changes. A cost is not inherently fixed or variable in every context; its behavior depends on the relevant time period and the activity being measured.
Fixed costs stay broadly unchanged in total within a relevant range of activity. Examples can include monthly premises rent, salaried supervision, insurance, and equipment depreciation.
Variable costs change in total as units sold or produced change. Materials, sales commissions, delivery packaging, and per-unit royalties are common examples.
🔎 Understand the relevant range
The relevant range is the band of activity where the assumptions about cost behavior are reasonably valid. A café may need one manager up to a certain volume of sales, but a second manager beyond that point. Fixed cost then rises in a step.
Similarly, a supplier discount may reduce material cost after a volume threshold. Break-even calculations are most reliable when projected sales sit within a range where the price, unit variable cost, and fixed cost assumptions make practical sense.
🧮 Define contribution margin
Contribution margin is the sales revenue left after variable costs are subtracted. It is called “contribution” because it first contributes toward covering fixed costs; once fixed costs are covered, it contributes toward profit.
For one unit, the formula is:
Contribution margin per unit = Selling price per unit − Variable cost per unitIf a product sells for $50 and has a variable cost of $30, its contribution margin is $20 per unit. Every additional unit sold contributes $20 toward fixed costs and then profit, assuming the inputs do not change.
📊 Calculate the contribution margin ratio
The contribution margin ratio, sometimes called the CMR or contribution-to-sales ratio, expresses contribution as a percentage of sales. It is especially useful when sales are measured in dollars rather than physical units.
Contribution margin ratio = Contribution margin ÷ Sales revenue
Contribution margin ratio = (Selling price − Variable cost) ÷ Selling price
Using the $50 product with a $20 unit contribution margin, the ratio is 40% ($20 ÷ $50). In broad terms, each sales dollar generates $0.40 to cover fixed costs and profit.
💡 Contribution margin is not gross margin
These terms are related but not interchangeable. Gross margin generally deducts cost of goods sold from revenue under financial reporting conventions. Depending on the business, that cost can include items that are fixed, variable, or mixed.
Contribution margin deducts only costs that vary with the chosen activity measure. A manufacturer may include factory rent in gross margin calculations but exclude it from variable costs in a contribution margin analysis. Always check which costs have been included.
⚖️ The basic unit break-even formula
When a business sells one product or can express output in a common unit, the break-even point in units is:
Break-even units = Fixed costs ÷ Contribution margin per unitSuppose fixed costs are $24,000 per month, the selling price is $50, and variable cost is $30 per unit. Contribution margin is $20, so break-even volume is 1,200 units ($24,000 ÷ $20).
At 1,200 units, sales revenue is $60,000 and variable costs are $36,000. The remaining $24,000 exactly covers fixed costs, leaving zero profit.
💵 The break-even sales revenue formula
Where units are difficult to count, calculate the break-even point in sales dollars:
Break-even sales = Fixed costs ÷ Contribution margin ratioWith fixed costs of $24,000 and a 40% contribution margin ratio, break-even sales are $60,000 ($24,000 ÷ 0.40). This agrees with the unit calculation because 1,200 units at $50 each generate $60,000.
Do not divide by “40” rather than “0.40.” A percentage must be converted to its decimal form before use in the formula.
🧾 Build a simple contribution income statement
A contribution format income statement makes the logic visible. It groups costs by behavior, rather than by the traditional classifications used for external reporting.
| Monthly illustration | Amount |
|---|---|
| Sales: 1,500 units × $50 | $75,000 |
| Variable costs: 1,500 units × $30 | ($45,000) |
| Contribution margin | $30,000 |
| Fixed costs | ($24,000) |
| Operating profit | $6,000 |
The statement shows why sales beyond break-even matter. At 1,200 units, contribution is $24,000 and profit is zero. The next 300 units add $6,000 of contribution and, if fixed costs remain stable, $6,000 of operating profit.
🎯 Add a target profit to the calculation
Breaking even is often only a minimum goal. Managers usually need a desired operating profit to reward owners, fund growth, or satisfy a budget.
Required unit sales = (Fixed costs + Target profit) ÷ Contribution margin per unit
Required sales revenue = (Fixed costs + Target profit) ÷ Contribution margin ratio
If the illustration business wants a monthly operating profit of $10,000, it needs 1,700 units: ($24,000 + $10,000) ÷ $20. This treats target profit as an additional amount that contribution must cover.
🧾 Clarify before-tax and after-tax targets
Most classroom and internal planning problems use a before-tax target profit. If management instead has an after-tax target, the target must be converted to the necessary pre-tax amount using an assumed tax rate.
Tax rules, loss carryforwards, deductions, and jurisdictional differences can complicate real calculations. For decision models, document the tax assumption and avoid presenting a tax-based estimate as a complete tax forecast.
🛟 Define margin of safety
Margin of safety measures how far actual or budgeted sales exceed break-even sales. It indicates the amount by which sales could fall before the business reaches the break-even point.
Margin of safety = Actual or budgeted sales − Break-even sales
Margin of safety percentage = Margin of safety ÷ Actual or budgeted sales
It is a cushion, not a guarantee. A business with a wide margin of safety may still face cash pressure, quality problems, or unexpected changes in costs. But it gives a direct view of profit vulnerability to a sales decline.
📉 Calculate margin of safety with the example
At 1,500 planned units, the example business has sales of $75,000. Its break-even sales are $60,000, so its margin of safety is $15,000, or 300 units.
The percentage margin of safety is 20% ($15,000 ÷ $75,000). Under the model’s assumptions, sales could decline by 20% before the business reaches break-even. Below that threshold, it would report an operating loss.
📐 Use the profit-volume relationship
After break-even, each additional unit generally increases profit by the contribution margin per unit. Before break-even, each lost unit reduces contribution and deepens the loss by that same amount.
This relationship is sometimes summarized as a profit-volume relationship. In the example, increasing sales from 1,500 to 1,600 units raises profit by $2,000, provided the $20 unit contribution and fixed costs remain unchanged.
📈 Read the break-even chart carefully
A break-even chart places activity, such as units sold, on the horizontal axis and dollars on the vertical axis. A total revenue line begins at zero and rises with sales. A total cost line starts at fixed costs and rises as variable costs are added.
The point where the two lines cross is break-even. To the left is the loss area; to the right is the profit area. The chart is useful for communication, but it can hide assumptions, so pair it with clear calculations.
🏷️ See how a price change affects break-even
A price increase can raise contribution per unit and lower break-even volume, assuming unit variable cost and sales demand stay unchanged. A price cut usually has the opposite mechanical effect.
For example, raising price from $50 to $55 while variable cost stays $30 increases unit contribution from $20 to $25. Break-even drops from 1,200 to 960 units. Yet the decision cannot stop there: a higher price may reduce volume, while a lower price may attract enough extra demand to improve total profit.
🧰 See how variable cost changes affect profit
Variable cost increases reduce contribution unit by unit. This is why material price changes, commissions, wastage, freight, and payment-processing fees deserve attention in planning models.
If the original product’s variable cost rises from $30 to $33, contribution falls to $17. With $24,000 of fixed costs, break-even rises to about 1,412 units. Because partial units cannot normally be sold, a practical plan rounds up to the next whole unit.
🏢 See how fixed cost changes affect the threshold
A new lease, advertising campaign, salary commitment, or equipment contract increases fixed costs and raises break-even sales unless it also changes price, volume, or unit contribution.
Fixed costs can be strategically sensible. A machine that increases capacity or reduces material waste may improve long-term economics. The point is not to avoid fixed costs, but to understand the additional contribution needed to support them.
🔀 Handle multiple products with sales mix
Multi-product businesses cannot usually calculate one meaningful break-even unit total without considering sales mix: the relative proportion in which products are sold. A high-contribution product and a low-contribution product may use very different resources and generate different amounts of contribution.
A common approach uses a weighted-average contribution margin based on an expected, stable sales mix. The resulting break-even point applies only while that mix remains reasonably close to the assumption.
🧺 Use a composite unit for a sales mix
Suppose a business expects to sell two standard products for every one premium product. If standard units contribute $12 and premium units contribute $30, one composite bundle of two standard and one premium unit contributes $54.
If fixed costs are $10,800, break-even is 200 composite bundles ($10,800 ÷ $54). That means 400 standard units and 200 premium units under the assumed 2:1 mix. Selling more lower-contribution standard units than expected would change the result.
🧩 Treat service businesses differently, not separately
Service organizations also use break-even analysis, although their “unit” may be a billable hour, customer visit, occupied room-night, subscription, or project. A consultant might use contribution per billable hour after directly variable travel, contractor, or platform costs.
Capacity is often more restrictive in services. There are only so many appointments or billable hours available. A break-even target above realistic capacity signals that the price, cost structure, or delivery model needs reconsideration.
⏱️ Choose the right activity driver
Units sold are not always the cause of variable cost. A courier may incur costs per delivery mile; a clinic may consume supplies per procedure; a factory may incur setup costs per production batch.
Select the activity driver that best explains the cost being modeled. For a quick decision, an approximate unit cost may be enough. For pricing or capacity decisions, a more detailed model can prevent a misleading contribution estimate.
🧪 Run sensitivity analysis instead of trusting one forecast
Forecasts are assumptions, not outcomes. Sensitivity analysis tests what happens when one or more assumptions change: selling price, volume, variable cost, fixed cost, or product mix.
- What is break-even if sales price is 5% lower?
- What happens if materials cost more than expected?
- Can the available capacity meet the target-profit volume?
- How does a mix shift toward lower-contribution products affect results?
A base, cautious, and optimistic scenario can be more informative than a single precise-looking estimate. The goal is to identify the assumptions that most influence risk.
💳 Remember that profit is not cash flow
Break-even analysis typically focuses on accounting revenue and costs. Cash timing may differ because customers pay later, suppliers require deposits, inventory is purchased in advance, or loan principal payments must be made.
A business can be profitable on paper while short of cash. For cash planning, combine break-even analysis with a cash budget that identifies when receipts and payments occur.
🚧 Recognize the model’s key assumptions
Basic cost-volume-profit analysis commonly assumes a linear revenue and cost relationship, a constant sales price, constant unit variable cost, stable fixed costs, known sales mix, and production roughly equal to sales.
Those assumptions are often useful over a limited planning range, not universal truths. Quantity discounts, overtime, inventory changes, capacity constraints, returns, and inflation can all weaken the model. State the assumptions beside the result.
⚠️ Avoid common calculation mistakes
Many errors come from mixing total and per-unit amounts. Others come from using an accounting expense classification rather than actual cost behavior.
- Subtracting all expenses, including fixed costs, when calculating contribution margin.
- Using total variable cost where variable cost per unit is needed.
- Calculating break-even units with a contribution margin ratio.
- Ignoring taxes when an after-tax target was requested.
- Rounding break-even sales down when whole units are required.
- Assuming a multi-product sales mix will remain unchanged without checking it.
🗂️ Gather reliable inputs before using the formulas
Good output starts with good inputs. Review recent invoices, payroll arrangements, lease terms, sales data, production records, and contracts rather than relying only on a broad annual budget.
For mixed costs, separate fixed and variable components using a reasonable method. Also document the time period, currency, expected sales volume, capacity limit, and whether the figure is based on budgeted, actual, or forecast data.
🧑💼 Use the results for decisions, not just homework
Managers use contribution information to evaluate pricing proposals, promotional discounts, product lines, capacity additions, outsourcing choices, and sales targets. The strongest use is comparative: how will a proposed change alter contribution, risk, and capacity needs?
For a short-term decision, a product that contributes positively may help cover unavoidable fixed costs. Over the long term, however, the business must recover all relevant costs and earn an acceptable return. A positive contribution alone does not prove a product should remain indefinitely.
📝 A repeatable calculation workflow
Use a consistent sequence to make the analysis easier to audit and update:
- Define the period, product or service, and activity measure.
- Separate relevant fixed costs from variable costs.
- Calculate unit selling price, unit variable cost, and contribution margin.
- Calculate the contribution margin ratio.
- Find break-even in units or sales revenue.
- Add a target profit if planning a required sales level.
- Calculate margin of safety using actual or budgeted sales.
- Test key assumptions and compare the result with capacity.
🧠 Bring the three measures together
Contribution margin explains the economics of one additional sale. Break-even point converts fixed costs into a sales threshold. Margin of safety shows the distance between expected sales and that threshold.
Together, they create a practical operating story: what each sale contributes, how much activity is required to avoid a loss, and how exposed the plan is if demand falls. Their value comes from using realistic inputs, clear assumptions, and regular updates as conditions change.
Know your contribution, calculate the sales needed to cover fixed costs, and treat your margin of safety as a measure of risk—not a promise of profit.
A simple model cannot replace judgment, but it can make judgment more disciplined. Revisit the numbers when prices, costs, capacity, or sales mix change, and let the analysis guide better questions before it guides decisions. 💰📊🛟