
A café owner proudly reports that sales rose 25% this year. The dining room is busier, online orders are climbing, and the point-of-sale system shows more money coming in every week.
Yet the owner feels more stretched than before. Payroll has increased, ingredient prices have risen, delivery platforms take commissions, and a larger loan payment is due each month. The business may be selling more—but is it actually earning more?
This is a common business puzzle. Revenue is highly visible, easy to celebrate, and often treated as proof of success. Profitability is less obvious because it requires looking beneath sales at costs, pricing, financing, timing, and cash.
For students, managers, founders, and investors, learning to separate revenue growth from profit growth is one of the most useful habits in financial analysis.
📈 Revenue is the amount earned from sales
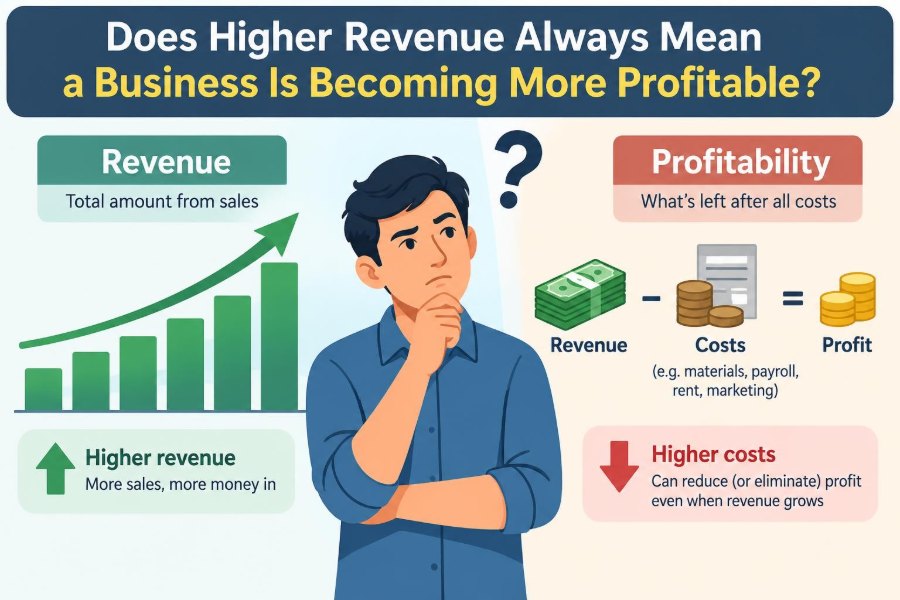
Revenue is the income a business earns from providing goods or services before subtracting most costs. A retailer records revenue when it sells products; a consultant records revenue when services are delivered under the applicable accounting policy.
Revenue answers a narrow but meaningful question: How much did customers buy? It does not answer how much the business kept after the resources required to make those sales.
In everyday conversation, people may call revenue “sales,” “turnover,” or “top-line income.” The phrase top line comes from the usual placement of revenue near the top of an income statement.
💵 Profit is what remains after relevant costs
Profit is the amount remaining after expenses are deducted from revenue. The basic relationship is simple:
Profit = Revenue − ExpensesBut the word “expenses” covers many different items: inventory, wages, rent, software, advertising, insurance, interest, depreciation, taxes, and more. A rise in sales can coexist with flat or falling profit whenever expenses rise faster than revenue.
That is why a business can look successful from the street—more customers, more orders, more locations—while its financial results quietly weaken.
🧭 The top line and bottom line tell different stories
Revenue growth can signal customer demand, stronger distribution, a successful launch, or higher prices. These are valuable developments, but they are not the same as stronger economic performance.
Net profit, often called the bottom line, is closer to the question owners ultimately care about: after all the period’s costs, did the business create a surplus?
Neither number should be viewed alone. A company with declining revenue may improve profitability by eliminating unprofitable products. A fast-growing company may accept temporarily lower profits to build capacity. Context matters.
🧾 Gross profit reveals the economics of each sale
For businesses that sell physical products, gross profit is generally revenue minus the cost of goods sold. That cost includes the direct cost of inventory that was sold, such as materials, production labor, or wholesale purchase cost.
If a shop sells a jacket for $100 that cost $60 to buy, its gross profit is $40. That $40 must still cover rent, staff, marketing, utilities, and other operating costs.
A growing revenue figure with shrinking gross profit deserves attention. It may indicate heavier discounting, rising supplier costs, theft or waste, unfavorable product mix, or pricing that has not kept up with costs.
🏢 Operating profit focuses on the core business
Operating profit considers the costs of running the business after gross profit: payroll, premises, sales effort, administration, and similar operating expenses. It helps show whether normal operations are producing a surplus.
It usually excludes items that may be less connected to day-to-day operations, such as interest expense and income taxes. The exact presentation can vary by business and reporting framework, so readers should check what is included.
This measure is useful when comparing a company’s core performance over time. A business might report higher sales but lower operating profit because it hired ahead of growth or opened expensive new locations.
🧮 Net profit includes the full financial picture
Net profit includes operating performance along with items such as financing costs, taxes, and sometimes unusual gains or losses. It represents the broadest income-statement view of what remains for the period.
A business can have healthy operating profit but weak net profit if debt carries substantial interest costs. Conversely, a one-time asset sale can increase net profit without making normal operations more efficient.
For this reason, analysts often read several profit measures together instead of treating one line as a complete verdict.
📊 Profit margin puts sales and profit on the same scale
A profit amount alone can mislead when business size changes. Profit margin expresses profit as a percentage of revenue:
Profit margin = Profit ÷ RevenueSuppose revenue rises from $1,000,000 to $1,200,000 while net profit rises from $80,000 to $84,000. Profit increased in dollars, but net margin fell from 8% to 7%.
The business earned more total profit, yet each dollar of revenue generated less profit than before. That trade-off may be sensible during expansion, but it should be understood rather than hidden by a headline about sales growth.
🔎 A simple example of sales rising while profit falls
Consider a hypothetical online retailer. Last year it generated $500,000 of revenue and incurred $420,000 of total expenses, leaving $80,000 of profit.
This year, revenue grows to $650,000. However, product costs rise by $90,000, shipping subsidies rise by $45,000, advertising rises by $55,000, and additional support staff cost $30,000. Total expenses reach $640,000.
Revenue has increased by $150,000, but profit has fallen to $10,000. More orders created more activity, not more value for the owner.
🏷️ Discounting can purchase revenue at a high cost
Promotions can attract customers, clear inventory, and introduce a brand to new markets. Used carefully, they can be a practical commercial tool.
But a discount reduces the amount available to cover costs. If a product has a thin gross margin, a modest price cut can remove most or all of the profit from the sale.
Managers should ask whether discounted customers later buy at regular prices, whether promotion-driven volume displaces full-price sales, and whether the campaign earns a positive contribution after direct costs.
🛒 Product mix can change without obvious warning
Not all revenue is equally profitable. A company might sell more of a low-margin product and less of a high-margin service, causing total sales to rise while overall margins fall.
A technology retailer, for example, may earn a small margin on hardware but a larger margin on installation, maintenance, or training. A sales increase driven mostly by hardware may look impressive while contributing less than expected.
Breaking revenue and gross margin down by product, customer group, location, or sales channel often exposes this shift.
📦 Variable costs grow with activity
Variable costs generally rise as a business sells or produces more. Examples include raw materials, packaging, sales commissions, card-processing fees, fulfillment charges, and per-order shipping.
More sales are profitable only when the extra revenue exceeds the extra variable cost. This excess is called contribution margin, because it contributes toward fixed costs and then profit.
A business that ignores variable costs may celebrate a high-volume contract that actually produces very little contribution—or even a loss—once all direct costs are counted.
🏠 Fixed costs do not disappear when revenue rises
Fixed costs are costs that tend not to change immediately with each additional sale, such as a lease, core management salaries, or annual software subscriptions. They still must be covered.
Revenue growth can improve profitability when fixed costs remain stable, because those costs are spread across more sales. This is often called operating leverage.
However, growth can also trigger a new warehouse, a larger team, more equipment, or another location. Once those step-up costs appear, the expected benefit of operating leverage may be delayed.
⚖️ Break-even analysis shows the minimum sales needed
The break-even point is the sales level at which total revenue equals total costs. Below it, the business loses money; above it, additional sales may generate profit if pricing and cost behavior hold.
A simplified calculation uses fixed costs divided by contribution margin per unit. Real operations can be more complex because businesses sell many products and costs do not always behave neatly.
Still, break-even analysis is a useful planning tool. It turns “we need more sales” into a more precise question: how many profitable sales are needed to cover the next cost commitment?
👥 Customer acquisition costs can swallow growth
Many businesses spend money to win new customers through advertising, sales commissions, referral payments, free trials, or introductory offers. These costs may rise sharply when an easy-to-reach audience has already been served.
If it costs more to acquire each new customer than the gross profit the customer is likely to generate, revenue growth can destroy value. The customer may still be worth pursuing if repeat purchases are likely, but that expectation should be tested carefully.
Separating new-customer sales from repeat-customer sales helps managers see whether demand is becoming more durable or more expensive to buy.
🚚 Growth can create operational inefficiency
Rapid expansion can overwhelm processes designed for a smaller business. Errors, returns, overtime, expedited freight, stockouts, customer-service backlogs, and rework can all increase costs.
These problems are not proof that growth is bad. They are signs that capacity and controls have not caught up with demand.
Useful operating measures include return rates, order accuracy, labor hours per unit, delivery cost per order, and inventory write-offs. Financial statements show the result; operational metrics often explain the cause.
📉 Rising input prices can erode margins
A business may sell more simply because customer demand is strong, while the cost of materials, labor, energy, freight, or components rises at the same time. If the company cannot pass those costs on through pricing, margins shrink.
Price increases are not automatically painless. Customers may buy less, switch brands, or choose lower-priced products. The best response depends on competitive conditions, product differentiation, contracts, and customer sensitivity.
Monitoring gross margin by product is usually more informative than watching revenue alone during periods of cost volatility.
🧱 Capacity investments may reduce profit before supporting it
A growing manufacturer may buy machinery, a service firm may hire and train staff, and a retailer may build inventory before opening new outlets. These investments can reduce current profit or cash while preparing the business for future sales.
That does not make the growth strategy irrational. The relevant question is whether the expected future contribution is sufficient to justify the investment and its risks.
Managers should distinguish between a planned, temporary margin reduction and an unexplained deterioration that persists after the investment period.
💳 Revenue is not the same as cash collected
A company can record revenue before it has received cash, particularly when it sells on credit. The unpaid amount becomes accounts receivable.
If sales rise but customers pay slowly, cash can become tight even when the income statement shows a profit. The business may struggle to pay employees, suppliers, taxes, or lenders.
This is especially dangerous for fast-growing businesses because larger sales often require more inventory, labor, and other spending before customer cash arrives.
🌊 Working capital can absorb the cash from growth
Working capital broadly refers to short-term operating resources, including receivables, inventory, and payables. Growth often increases the funds tied up in receivables and stock.
Imagine a wholesaler that must buy inventory now, sell it next month, and wait another month for the customer to pay. Higher sales can enlarge this cash gap.
Cash-flow forecasting helps reveal the issue early. Profit forecasts alone cannot show whether the business has enough cash to finance its normal operating cycle.
🗓️ Accounting timing can complicate comparisons
Revenue and expenses are generally recorded using accrual accounting, which aims to match activity to the period in which it occurs rather than simply tracking cash movements. Judgments about timing can affect period-to-period results.
Seasonality also matters. A toy retailer may build inventory and incur marketing costs before a major sales season. Comparing one month with the previous month could create a misleading impression.
Better analysis compares equivalent periods, considers seasonal patterns, and reviews the notes and accounting policies where relevant.
🔄 One-time items can make profit look stronger or weaker
A legal settlement, restructuring charge, asset sale, impairment, or unusual repair may materially affect reported profit in one period. These items should not be ignored, but they may not represent normal recurring performance.
When reviewing results, separate two questions: what was the reported profit, and what does the underlying operating trend appear to be?
Removing every unfavorable item is not honest analysis. The goal is to identify whether an item is genuinely unusual and to understand its cash, risk, and future implications.
🧾 Taxes and interest can change the owner’s outcome
Higher revenue does not reveal how a business is financed. Two companies with similar operations can have very different net profits if one carries more debt and therefore pays more interest.
Taxes also depend on jurisdiction, structure, timing, deductions, and profitability. They should not be treated as a simple fixed percentage in every situation.
Operating measures help assess the business engine; net profit and cash flow show the wider financial consequences of ownership and financing decisions.
📏 Compare performance with useful ratios
Ratios turn a set of financial statements into questions that can be compared across periods. No single ratio gives a complete answer, but a small dashboard is more revealing than revenue alone.
| Measure | Basic calculation | What it can reveal |
|---|---|---|
| Revenue growth | Change in revenue over time | Whether customer sales are expanding or contracting |
| Gross margin | Gross profit ÷ revenue | Pricing, direct costs, and product mix |
| Operating margin | Operating profit ÷ revenue | Efficiency of core operations |
| Net margin | Net profit ÷ revenue | Overall profit retained from sales |
| Receivables days | Receivables relative to credit sales | How quickly customers tend to pay |
Ratios should be interpreted alongside the business model. A restaurant, a construction contractor, and a software provider can have very different normal margins and cash cycles.
🧪 Use unit economics before scaling a promising idea
Unit economics asks whether one unit of activity is economically worthwhile: one subscription, one delivery, one service job, one occupied room, or one product order.
For each unit, estimate revenue, direct costs, variable selling costs, expected refunds or returns, and the contribution left to cover fixed costs. This approach is particularly useful when a company is growing quickly.
If each additional unit loses money, scaling may increase losses. If each unit makes a healthy contribution, growth can be attractive—provided capacity, cash, and customer retention are managed.
🎯 Revenue quality matters as much as revenue quantity
High-quality revenue tends to be repeatable, collectible, appropriately priced, and generated without excessive concessions. It is not merely a large invoice total.
Examples may include recurring customer relationships, diversified demand, reasonable payment terms, and sales with sustainable gross margins. Lower-quality revenue may depend on one-off deals, deep discounts, unusually long credit, or a single dominant customer.
This is not a rigid classification. A one-time project can be highly profitable, and recurring sales can become unprofitable if they are underpriced. The point is to assess the conditions behind the number.
🚩 Warning signs behind impressive sales growth
Revenue deserves investigation when it rises alongside signs of financial strain. None of these signals proves trouble on its own, but together they justify a closer look.
- Gross margin or net margin is falling.
- Receivables or inventory are growing faster than sales.
- Discounts, returns, or warranty claims are increasing.
- Customer acquisition spending rises faster than gross profit.
- Cash flow from operations is persistently weaker than reported profit.
- Management cannot explain which products or customers are driving growth.
Good analysis asks for the mechanism, not just the outcome. What specifically changed in pricing, cost, volume, mix, timing, or financing?
🛠️ Practical actions to make growth more profitable
Improving profitability rarely means cutting every cost. It means protecting the activities that create value and addressing costs or sales that do not.
- Review pricing after changes in direct costs, not only once a year.
- Measure margins by product, customer, channel, and location.
- Set approval rules for discounts and exceptions.
- Improve purchasing, scheduling, inventory control, and fulfillment accuracy.
- Speed up invoicing and actively manage collections.
- Test expansion plans against contribution margin, capacity needs, and cash forecasts.
Small improvements in price realization, waste, or payment collection can matter more than a broad push for volume.
🧠 Avoid treating every cost increase as waste
Not every expense increase is a warning sign. Better staff training, stronger quality control, preventive maintenance, cybersecurity, or customer support may raise costs today while reducing larger problems later.
The question is whether spending has a clear operational purpose and whether results can be measured over a reasonable period. Blind cost cutting can weaken service, damage retention, and create hidden future costs.
Likewise, a period of lower profit can be acceptable if management can explain the investment, monitor milestones, and preserve enough liquidity to execute the plan.
👔 Questions managers should ask each month
A regular review keeps revenue from becoming the only headline. Management discussions are stronger when they connect income statement, balance sheet, cash flow, and operating data.
- Did profit grow at least as thoughtfully as revenue, and why or why not?
- Which products and customers produced the most contribution?
- What changed in price, volume, mix, and direct cost?
- Are receivables, inventory, and payables creating a cash pressure?
- Which expenses are temporary investments, and which are becoming permanent?
- What assumptions must hold for the next growth plan to work?
Clear answers help managers intervene before a sales problem becomes a cash or profitability problem.
🎓 What students and professionals should take from the income statement
When analyzing a business case, avoid jumping from “revenue increased” to “the company performed better.” Start by tracing the path from sales to gross profit, operating profit, net profit, and operating cash flow.
Then look for drivers: unit volumes, prices, product mix, direct costs, overhead, financing, and working capital. This sequence builds a disciplined explanation instead of a superficial conclusion.
In professional settings, it also improves communication. Saying “revenue is up but gross margin fell because lower-margin channel sales grew faster” is far more actionable than simply reporting that sales increased.
✅ Higher revenue is a signal, not a final answer
Higher revenue can be excellent news. It may reflect stronger demand, a successful strategy, better customer reach, or a business gaining scale. But it becomes financially meaningful only when the additional sales produce sufficient contribution, cover the costs of growth, and support healthy cash flow.
The core principle is simple: a business is becoming more profitable when it keeps more value from its sales, not merely when it makes more sales. Reading revenue alongside margins, costs, cash, and capacity turns a tempting headline into a sound financial conclusion.
Celebrate the extra customers—but also follow where each sales dollar goes. That is where the real story of business performance is found. 📈💵🔍