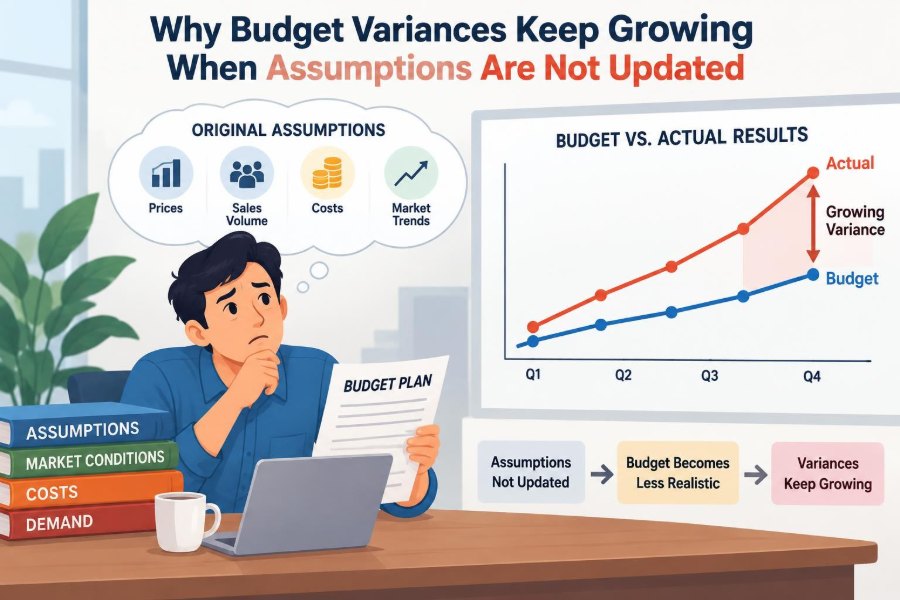

A department submits a budget built carefully three months ago. Sales volumes looked plausible, payroll was based on the open roles then in the plan, and supplier prices reflected the most recent invoices. By the next reporting cycle, actual results are drifting away from budget.
The first response is often to ask who overspent. But a growing variance is not always evidence of poor cost control. It may be evidence that the business is still comparing reality with an old view of reality.
This matters because budgets guide hiring, purchasing, pricing, cash planning, performance discussions, and management decisions. When their assumptions become stale, the budget can remain internally consistent while becoming operationally misleading.
Understanding that distinction changes the conversation. Instead of treating every unfavorable variance as a failure, finance teams can identify whether the issue is execution, changed conditions, weak planning logic, or a mixture of all three.
🧭 A budget is a model, not a prediction
A budget is a financial model of expected activity. It translates assumptions about volume, prices, staffing, timing, exchange rates, capacity, and other drivers into revenue, cost, profit, and cash expectations.
That model is useful precisely because it gives the organization a common baseline. Yet it is not a permanent truth. Once underlying conditions change, a budget can become less relevant even if nobody has made an accounting error.
Variance analysis works best when it compares actual performance with a relevant expectation. If the expectation is obsolete, the reported variance may describe the distance from an old plan more than the quality of current performance.
📏 What a budget variance actually measures
A budget variance is the difference between an actual result and a budgeted result for a period. For expenses, actual spending above budget is commonly unfavorable; for revenue, actual revenue below budget is commonly unfavorable. The labels depend on the measure being analyzed.
For example, a budget may allow $100,000 of materials expense, while actual expense is $115,000. The $15,000 difference is the total variance. It does not, by itself, explain whether material prices rose, production volume increased, waste worsened, or the expense was recorded in the wrong month.
Variance is therefore a signal, not a diagnosis. Its value depends on separating the number into understandable business drivers.
🔄 Assumptions are the moving parts beneath the numbers
Budget assumptions are the inputs that produce budget line items. A payroll budget may rest on headcount, start dates, salary rates, overtime, benefit costs, and expected vacancies. A sales budget may depend on units sold, customer mix, selling price, renewal rates, and delivery timing.
Many assumptions are explicit in a planning workbook. Others are embedded in formulas, copied from prior periods, or held informally by managers. Hidden assumptions are especially risky because they are less likely to be reviewed when conditions move.
A budget line can look stable while its drivers have changed substantially. That is why reviewing only the final dollar amount is rarely enough.
📈 Why unchanged assumptions create widening gaps
When an assumption is wrong for one month and is left unchanged, the next month often begins with the same error built into the comparison. If the changed condition persists, the cumulative year-to-date variance grows.
Imagine a manufacturer budgeting freight at a rate based on a former shipping contract. If the new contract costs more per shipment, every shipment creates a small unfavorable variance. The variance expands as shipments accumulate, even if the logistics team is operating exactly as planned.
This is the compounding effect of stale assumptions: the variance is repeatedly measured against a baseline that no longer represents the operating environment.
🗓️ Timing changes can look like performance problems
Not every variance reflects a changed total cost or revenue expectation. Some arise because activity occurs earlier or later than planned. A project launch delayed by a month can shift contractor expense, marketing spend, revenue recognition, and cash collection at the same time.
If the annual plan still holds, the year-end result may eventually align with budget. But monthly reporting can show sharp unfavorable and favorable swings that lead to unnecessary escalation.
Finance should distinguish timing variance from a permanent run-rate change. A timing explanation needs evidence: a revised delivery schedule, signed project plan, production calendar, or other operational source—not merely optimism that results will “catch up.”
📦 Volume assumptions affect more than revenue
Volume is one of the most powerful budget drivers. A business may sell more units than planned, process more orders, serve more customers, or produce more output. That can improve revenue while increasing variable costs such as materials, shipping, sales commissions, payment fees, and hourly labor.
Without adjusting for volume, managers may see an unfavorable cost variance and conclude spending was inefficient. Yet the cost could be appropriate for higher activity.
A flexible budget helps here. It restates expected variable costs for the actual level of activity, making it easier to separate the cost of doing more work from the cost of doing work inefficiently.
⚖️ Static and flexible budgets answer different questions
A static budget remains at the original planned activity level. It is useful for evaluating progress against the approved plan, resource commitments, and the original financial target.
A flexible budget adjusts selected costs and revenues using actual or revised activity levels. It is useful for operational analysis because it recognizes that a warehouse handling more orders should consume more packing materials and labor hours.
| Comparison | Static budget | Flexible budget |
|---|---|---|
| Activity level | Original planned volume | Actual or revised volume |
| Best use | Plan accountability and target tracking | Efficiency and rate analysis |
| Main risk | Confusing volume effects with cost control | Masking failure to meet original volume goals |
Neither approach replaces the other. A disciplined review may show the static-budget variance, then explain it using a flexible budget and driver analysis.
🏷️ Price assumptions can expire quietly
Supplier prices, wage rates, utility tariffs, insurance premiums, interest rates, and foreign exchange rates can change after the annual budget is approved. In some cases, contractual notice periods make the changes predictable; in others, they emerge through purchasing activity or market movement.
Consider a hypothetical retailer that budgets inventory using last season’s purchase prices. A supplier increase takes effect in April, but the planning rate remains unchanged through December. Gross margin may appear to deteriorate month after month, even if sales teams and buyers are executing sensibly under the new pricing environment.
Price changes still deserve action. Procurement might seek alternatives, sales might revisit customer pricing, and management might review product mix. But the analysis begins by recognizing that the baseline must be updated or clearly bridged.
👥 Headcount plans become stale faster than payroll files
Payroll budgets often assume a specific hiring schedule. A delayed hire can create a favorable salary variance initially, while faster hiring, retention bonuses, overtime, or use of contractors can create unfavorable variance.
The complication is that payroll costs are not only base salary. Taxes, benefits, incentives, commissions, severance, and leave coverage can move differently from headcount. One vacant senior role replaced with two junior employees may change cost, capacity, and timing in different ways.
Reconcile budgeted positions to an updated workforce plan regularly. Comparing a general ledger total to a staffing budget without this bridge produces explanations that are broad but not actionable.
🏗️ Capacity constraints change unit economics
Many budgets assume that fixed costs are spread over an expected amount of output. When volume falls below that level, costs such as facility rent, salaried supervision, equipment depreciation, and certain software fees are allocated across fewer units.
The result can be a higher cost per unit even if total fixed spending remains controlled. Conversely, higher volume may improve unit costs until the business reaches a capacity limit and must add shifts, space, equipment, or management layers.
This is why a simple statement such as “unit cost is over budget” needs context. The cause may be operational waste, lower utilization, a planned investment, or a threshold effect from constrained capacity.
🧾 Revenue assumptions need drivers, not one total
A revenue budget built as one annual total is difficult to update intelligently. Better models connect revenue to operating drivers such as customer count, units, average selling price, contract start dates, renewal timing, conversion rates, and product mix.
For a subscription business, an unchanged renewal assumption can produce a growing revenue variance even when new sales meet plan. For a construction business, a revised project completion date can shift billings and revenue across quarters.
Breaking revenue into drivers does not guarantee accuracy. It does, however, make revisions explainable: the forecast changed because expected units, price, timing, or customer mix changed.
🧩 Mix changes hide inside favorable totals
Total revenue can meet budget while the underlying mix moves in an unfavorable direction. A company may sell more lower-margin products and fewer higher-margin products than planned. The revenue line looks healthy, but gross margin and cash conversion may not.
The same issue occurs in costs. Total payroll may remain within budget while specialized labor is replaced with more overtime or external contractors. The total obscures a change in cost structure and operational risk.
Reviewing mix is especially valuable when headline variances are small but margins, service levels, or working-capital balances are deteriorating.
🧮 Formula and master-data errors amplify stale logic
Some variance growth is caused by assumptions that are outdated; some is caused by systems continuing to apply them incorrectly. A wrong standard cost, inactive vendor rate, obsolete bill of materials, duplicate employee record, or incorrect allocation driver can affect many transactions.
These errors are dangerous because they can look like genuine business movement. A finance team may spend time debating operational explanations when the root cause is a maintenance issue in the planning model or enterprise system.
Include basic model controls: clear source ownership, effective dates, change logs, reconciliations between planning and source systems, and review of unusual movements after updates.
🔍 Separate forecast revision from budget revision
An updated forecast estimates where the organization now expects to finish, based on current information. A budget revision changes the formal plan or approved baseline. These are related but should not be treated as the same event.
Frequent forecast updates can improve decision-making without erasing accountability for the original budget. Leaders can still ask why actual results differed from plan while using the forecast to make realistic staffing, investment, and cash decisions.
If every unfavorable result is “fixed” by rewriting the budget, the organization loses the ability to learn from its planning and execution gaps. If the budget is never revisited conceptually, management may make decisions using a baseline nobody believes.
🚦 Materiality prevents review fatigue
Not every changed assumption deserves a formal reforecast. Reviewing every small movement consumes attention and encourages teams to explain noise rather than manage meaningful risk.
Set materiality thresholds that consider both dollar impact and decision relevance. A small variance in a highly constrained component may deserve review because it threatens production. A larger but temporary variance in a discretionary account may require monitoring rather than immediate action.
Thresholds should not become a reason to ignore recurring small changes. Repetition can turn individually minor movements into a material annual impact.
🧠 Leading indicators identify outdated assumptions early
Financial statements often reveal changes after activity has occurred. Leading indicators provide earlier evidence that budget assumptions need review. Examples include quotation volumes, purchase-order prices, staff acceptance rates, production yields, backlog, customer churn signals, and delivery milestones.
The best indicators are close to the assumption they monitor. If the key assumption is shipping cost per order, monitor carrier invoices and shipment characteristics—not only the monthly freight expense total.
Linking assumptions to observable indicators gives finance a practical early-warning system rather than a retrospective explanation process.
📅 Use a regular assumption review calendar
Assumptions should be reviewed on a rhythm that matches their volatility and business impact. Exchange rates or commodity-sensitive inputs may require frequent attention. Lease costs, annual insurance, and long-term contracts may need less frequent review unless a trigger occurs.
A useful calendar assigns each important driver an owner, source, review frequency, and escalation rule. The objective is not constant replanning; it is knowing which inputs have become unreliable.
- Review fast-moving operating drivers during the monthly close or forecast cycle.
- Review staffing, project, and demand assumptions with operating leaders.
- Review contractual rates when renewals, notices, or amendments occur.
- Document significant changes before they become unexplained year-to-date variances.
🤝 Assumption ownership belongs beyond finance
Finance owns the integrity of the financial model and the discipline of the reporting process. It rarely owns all of the underlying business facts. Sales leaders know pipeline quality, procurement knows supplier conditions, operations knows capacity, and human resources knows hiring conditions.
When finance silently updates assumptions without operational ownership, the model can lose credibility. When operating teams provide estimates without financial challenge, the forecast can become overly optimistic or inconsistent.
A stronger process pairs a business owner for each major driver with a finance partner who tests definitions, timing, evidence, and financial consequences.
🗂️ Create an assumption register
An assumption register is a concise record of the inputs that matter most to a plan or forecast. It turns vague institutional knowledge into something reviewable.
For each assumption, record the definition, current value, source, owner, effective date, confidence level where useful, and the financial lines affected. Include the rationale for a change so later reviewers can understand why the forecast moved.
This is not bureaucracy for its own sake. It makes it easier to distinguish a deliberate management judgment from a number copied forward by habit.
🧪 Test sensitivity before the variance appears
Sensitivity analysis asks what would happen if a significant assumption changed. Rather than claiming certainty, it shows the direction and approximate exposure of the plan.
For instance, a planning team can model a lower sales-volume case, a higher wage-rate case, or a delayed project-start case. The goal is not to create dozens of scenarios. It is to identify assumptions with enough leverage to warrant active monitoring.
Scenario work also improves conversations with leaders. Instead of debating whether one number is “right,” teams can discuss decisions under several plausible conditions.
🧱 Distinguish controllable from external drivers
Managers should be accountable for actions they can influence, while still reporting the full financial impact of external change. A sudden supplier increase may be external, but supplier selection, inventory strategy, customer pricing response, and consumption efficiency may be partly controllable.
This distinction prevents two poor outcomes: blaming managers for conditions they could not reasonably prevent, or treating all external changes as excuses for inaction.
A useful variance narrative states the driver, whether it was anticipated, who can respond, and what decision is needed next.
🗣️ A useful variance narrative has four parts
“Expense is over budget” is not a decision-ready explanation. A concise narrative should connect the number to cause and action.
- What happened: quantify the variance and identify the affected period.
- Why it happened: identify price, volume, mix, timing, rate, or process drivers.
- What has changed: state whether the underlying assumption is now different.
- What happens next: describe the forecast implication, owner, and required action.
For example: contractor cost is above the original monthly plan because a delayed hire extended external coverage; the revised hiring date is now confirmed; the forecast reflects coverage through that date; the workforce owner will reassess whether the role scope remains appropriate.
📊 Watch cumulative variance and run-rate together
Year-to-date variance shows the accumulated difference from budget. Monthly variance shows what changed recently. Run-rate estimates the likely ongoing level if current conditions continue. Each reveals something the others can miss.
A large year-to-date variance may be historical and no longer recurring. A modest year-to-date variance can conceal a rapidly worsening current-month run-rate. Looking at all three helps avoid overreacting to the past or missing a new trend.
Where seasonality is significant, compare against the correct seasonal pattern rather than dividing annual budgets evenly across months.
⚠️ Common responses that make the problem worse
Several habits allow assumption gaps to grow. One is explaining every variance as a one-off without checking whether the same driver appears again. Another is rolling prior-month forecast numbers forward simply because a new operational view is unavailable.
Other weak responses include:
- Using broad labels such as “market conditions” without identifying the affected driver.
- Changing assumptions without documenting the reason or effective date.
- Focusing only on unfavorable costs and ignoring favorable variances that may signal delayed investment or missed activity.
- Waiting until year-end to update a forecast that management uses for near-term decisions.
- Updating a total expense line while leaving its linked revenue, volume, staffing, or cash assumptions unchanged.
These practices make reporting less trustworthy because they obscure the relationship between operational reality and financial expectations.
🛠️ Build a practical monthly operating rhythm
A workable process need not be elaborate. After close, identify the largest and most decision-relevant variances. Trace each one to a driver, validate the driver with its operational owner, and assess whether it affects only the current month or the remaining forecast.
Then update the forecast through controlled inputs rather than manual adjustments to summary totals. Review resulting impacts on profit, cash, capacity, and commitments. Finally, record decisions, unresolved uncertainties, and triggers for the next review.
The discipline matters more than the software. A sophisticated planning platform cannot compensate for assumptions that nobody owns or tests.
💡 A simple hypothetical example
Suppose a service company budgets 1,000 monthly jobs at $500 each, with direct labor of $180 per job. It expects $500,000 of revenue and $180,000 of direct labor cost.
Actual volume rises to 1,100 jobs, while labor cost rises to $209,000 because wage rates increased and some work required overtime. Against the static budget, labor is $29,000 unfavorable. But a flexible labor budget at the original $180 rate for 1,100 jobs would be $198,000.
The analysis now shows two distinct facts: $18,000 of cost is explained by extra jobs, while $11,000 reflects a higher labor rate or lower efficiency. Management should celebrate or investigate the volume result separately from the labor-rate issue. Leaving the wage assumption unchanged would cause the latter gap to recur.
🔐 Governance protects credibility without slowing decisions
Forecast changes should be controlled, but control does not mean making every update difficult. Establish clear permissions for who can propose, review, and approve material changes. Preserve an audit trail of prior versions and key assumptions.
This supports accountability and helps explain why outlooks changed over time. It also reduces the risk that a forecast is altered to make a target look achievable without a documented business basis.
Good governance is proportionate. A routine update to an invoice-backed rate needs less approval than a change to a major revenue, financing, or restructuring assumption.
🎯 The core principle: refresh the drivers, not just the totals
Growing budget variances are often the visible consequence of assumptions that no longer match operations. The solution is not to abandon the budget, nor to revise every number whenever conditions move.
Instead, preserve the approved budget as a reference point, update the forecast when credible information changes, and explain the bridge between the two. Focus on the drivers that create the financial result: volume, price, mix, timing, workforce, capacity, and external rates.
When assumptions are current, variance analysis becomes a management tool. It directs attention toward decisions and actions rather than forcing teams to defend numbers that were outdated before the month even began.
A budget variance becomes useful when it reveals a real decision—not when it merely repeats the gap between actual results and an obsolete assumption. 💰📊🧭