
A café owner looks at a busy Saturday and assumes the business must be making money. A freelance designer sees a full calendar and feels equally confident. Yet both can finish the month with little profit—or a loss.
The missing question is not simply, “How much did we sell?” It is: how much sales volume was needed to cover every cost before profit could begin? That is the question answered by break-even analysis.
Break-even point turns a business model into a practical equation. It connects fixed costs, selling price, and the amount each sale contributes toward covering overhead. For students, it makes cost behavior concrete. For managers and founders, it provides a disciplined way to test prices, sales targets, and expansion decisions.
A break-even calculation is not a prediction machine. Demand can change, costs can move, and real businesses sell more than one product. Still, used with sensible assumptions, it is one of the clearest tools for understanding what profitability requires.
🧭 What Break-Even Point Actually Means
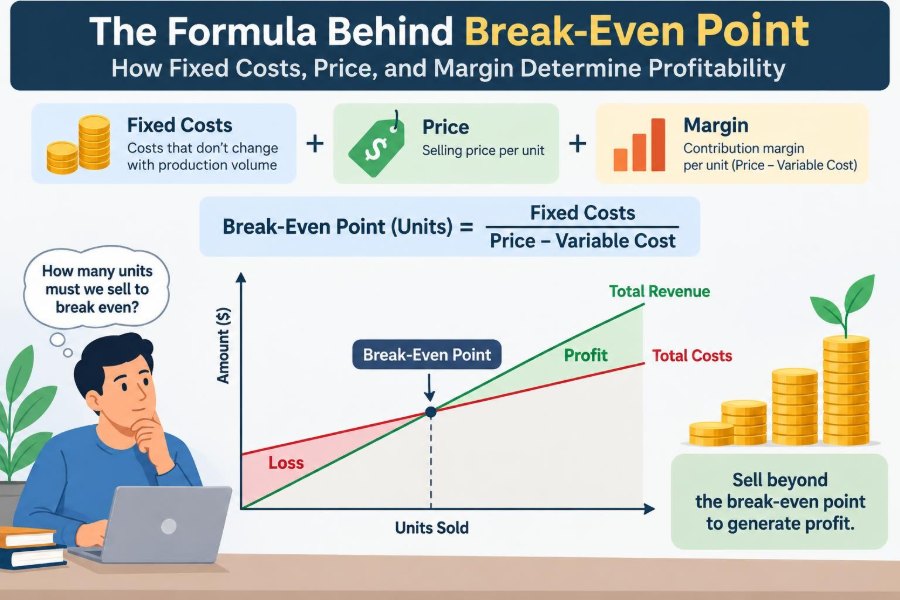
The break-even point is the level of sales at which total revenue exactly equals total costs. At this point, the business has no operating profit and no operating loss.
Below break-even, revenue does not cover all costs. Above break-even, each additional unit generally adds profit, assuming the price and unit variable cost stay within the relevant operating range.
Break-even can be expressed in units, such as subscriptions or meals sold, or in sales dollars. Units are often more intuitive when a business has one main product; sales dollars can be more useful for a company with many products.
🧱 The Cost Structure Behind the Formula
Every break-even calculation begins by separating costs according to how they behave as activity changes. The two central categories are fixed costs and variable costs.
Fixed costs remain broadly unchanged over a relevant period and capacity range, even when sales volume rises or falls. Variable costs change in total as units are produced or sold.
This is a planning model, not a claim that costs are permanently fixed or perfectly variable. Rent may be fixed for a lease term, for example, but can jump when a business relocates to a larger space.
🏢 Understanding Fixed Costs
Fixed costs are expenses a business must pay even if it makes no sales during the period. Common examples include base rent, salaried administrative staff, insurance, software subscriptions, equipment depreciation, and certain licenses.
“Fixed” does not mean “unimportant” or “unavoidable.” A business may be able to renegotiate, eliminate, or redesign a fixed cost over time. It simply means the cost does not move directly with each extra unit sold in the short run.
High fixed costs create pressure to reach sufficient volume. They can also create operating leverage: after break-even is reached, profit may rise quickly because fixed costs have already been covered.
📦 Understanding Variable Costs
Variable costs increase in total as sales volume increases. A bakery uses more flour, packaging, and delivery fuel when it sells more items. An online retailer may pay more payment-processing fees and shipping charges as orders grow.
The key measure is variable cost per unit. If each unit requires $6 of materials, labor, transaction fees, and sales commission, that $6 is deducted from each unit’s selling price before the unit can contribute to fixed costs or profit.
Some costs are mixed. Utility bills, for instance, may include a base service charge plus usage-dependent charges. For break-even purposes, managers often separate a mixed cost into estimated fixed and variable components.
🤝 Contribution Margin: The Crucial Middle Figure
The amount left from a sale after its variable costs is the contribution margin. It “contributes” first to fixed costs and then, once fixed costs are covered, to profit.
The formula per unit is:
Contribution margin per unit = Selling price per unit − Variable cost per unitIf a product sells for $25 and has a variable cost of $10, its contribution margin is $15. That does not mean the business earns $15 in profit on every sale from the first unit. Initially, that $15 helps pay rent, salaries, and other fixed costs.
🧮 The Core Break-Even Formula in Units
For a single product or service, the standard formula is:
Break-even units = Fixed costs ÷ Contribution margin per unitSuppose a tutoring business has monthly fixed costs of $3,600. It charges $90 per session, and estimated variable costs per session—including materials, payment fees, and tutor compensation—are $30.
The contribution margin is $60 per session. The break-even point is 60 sessions: $3,600 ÷ $60. At 60 sessions, the business covers its estimated monthly costs; session 61 begins to create operating profit under these assumptions.
💵 Calculating Break-Even Sales Revenue
Businesses also use the contribution margin ratio, which shows what proportion of each sales dollar remains after variable costs.
Contribution margin ratio = Contribution margin per unit ÷ Selling price per unitIn the tutoring example, the ratio is $60 ÷ $90, or 66.67%. The sales-dollar formula is:
Break-even sales = Fixed costs ÷ Contribution margin ratioSo break-even sales equal $3,600 ÷ 0.6667, or approximately $5,400. Minor rounding differences are normal; the underlying unit calculation remains the clearest check.
📊 A Worked Example from Start to Finish
Consider a hypothetical small meal-prep company. It sells each weekly meal plan for $80. Ingredients, containers, delivery, and card fees average $44 per plan. Monthly fixed costs are $10,800.
| Item | Amount |
|---|---|
| Selling price per meal plan | $80 |
| Variable cost per meal plan | $44 |
| Contribution margin per plan | $36 |
| Monthly fixed costs | $10,800 |
| Break-even volume | 300 plans |
| Break-even sales | $24,000 |
The calculation is $10,800 ÷ $36 = 300 meal plans. Notice that $24,000 of sales is not profit. It is the revenue level needed to cover the company’s combined fixed and variable costs.
📈 Why Selling Price Changes the Threshold
A higher price increases contribution margin if variable cost stays the same. That lowers the number of units needed to break even. But pricing cannot be treated as a purely mathematical lever: a price increase may reduce customer demand.
Using the meal-plan example, raising price from $80 to $85 would increase contribution margin from $36 to $41 if variable cost remains $44. The break-even volume would fall to about 264 plans.
The decision is sound only if the business can still sell enough plans at the new price and preserve its customer proposition. A lower break-even point on paper is not helpful if sales volume falls sharply.
🔧 Why Variable Cost Deserves Equal Attention
Cost control can lower break-even volume without asking customers to pay more. If the meal-prep company reduces variable cost from $44 to $40 while keeping its $80 price, contribution margin rises to $40.
Its break-even volume then becomes 270 plans instead of 300. The improvement comes from sourcing, waste reduction, packaging redesign, process efficiency, or better purchasing terms—not merely from cutting quality.
Reducing variable costs has limits. Cheaper ingredients, weaker service, or unreliable suppliers can damage demand and create returns or rework. A useful analysis includes the commercial consequences of cost changes.
⚖️ The Trade-Off Between Price, Cost, and Volume
Break-even is governed by a three-way relationship: fixed costs set the burden, price helps generate contribution, and variable cost reduces that contribution. Volume is the result the business must achieve.
A lower price may be sensible if it raises volume enough to offset the reduced contribution margin. Conversely, a premium price may work if customers value differentiation and demand remains adequate.
The formula does not decide strategy. It forces a strategy to reveal its numerical requirements. That is precisely why it is valuable.
🎯 Adding a Target Profit to the Calculation
Managers rarely want only to avoid a loss. They need to know sales required to earn a specified profit. The target-profit formula extends break-even analysis:
Required units = (Fixed costs + Target operating profit) ÷ Contribution margin per unitIf the tutoring business wants a monthly operating profit of $2,400, it needs ($3,600 + $2,400) ÷ $60 = 100 sessions. This calculation helps turn a broad goal into a sales target.
Be clear about which profit is being targeted. Operating profit usually excludes financing costs and income taxes. A desired after-tax personal income requires additional adjustments and professional judgment.
🛟 Margin of Safety and Business Risk
The margin of safety measures how far actual or expected sales are above break-even sales. It shows the sales decline a business could absorb before it reaches the loss-making zone.
Margin of safety = Actual sales − Break-even salesIf expected monthly sales are $30,000 and break-even sales are $24,000, the margin of safety is $6,000. It can also be stated as a percentage of expected sales.
A narrow margin of safety does not automatically make a business unsound, especially during launch or a seasonal period. It does mean modest disruptions in demand, price, or cost deserve close attention.
🏗️ Operating Leverage: Why Profits Can Move Fast
A company with substantial fixed costs and a high contribution margin may experience strong operating leverage. Once sales pass break-even, much of each additional unit’s contribution margin can flow into operating profit.
The same mechanism works in reverse. When sales fall, fixed costs remain, so profit can decline quickly. A theater, software company, fitness studio, or manufacturer may face this pattern, though each has a different cost structure.
Operating leverage is neither good nor bad by itself. It can reward reliable demand and scale, while increasing exposure when demand is uncertain.
🧾 Gross Margin Is Not Contribution Margin
These terms are related but not interchangeable. Gross margin generally deducts cost of goods sold from revenue under financial reporting conventions. Contribution margin deducts all costs that vary with the relevant sales activity.
A retailer’s shipping fees, sales commissions, and payment-processing charges may be variable costs for decision-making even if they are not included in cost of goods sold in the same way for external reporting.
For break-even analysis, the question is behavioral: does this cost increase because another unit is sold? Consistent cost classification matters more than the label alone.
🧩 Break-Even Analysis for Multiple Products
Most businesses sell a mix of products with different prices and contribution margins. In that setting, there is no single unit break-even point unless the expected sales mix is specified.
A company can calculate a weighted-average contribution margin based on the proportion of each product it expects to sell. It then estimates the number of composite “bundles” of that mix required to cover fixed costs.
This estimate becomes unreliable when the mix shifts materially. Selling more low-margin items than planned can increase total revenue while delaying profitability, which is why managers should track mix as well as sales.
🧺 A Simple Sales-Mix Illustration
Imagine a shop normally sells two basic products in a 2-to-1 pattern: two standard items with a $12 contribution margin each for every one premium item with a $30 contribution margin.
That three-item bundle provides $54 of contribution margin. If fixed costs are $5,400, the shop needs 100 such bundles, assuming the 2-to-1 mix holds. That means 200 standard items and 100 premium items.
If customers begin favoring standard items, the average contribution falls. The original break-even bundle count is no longer a dependable target, even if total units rise.
🕰️ Choose the Right Time Period
Costs and revenue must be measured over the same period. Monthly fixed costs should be paired with a monthly sales target; annual fixed costs should be paired with annual volume.
Seasonal businesses need special care. A ski rental shop may lose money in quiet months and earn enough during peak months to cover annual costs. A monthly break-even view can still support cash planning, but it should not be mistaken for the full-year picture.
Match the period to the decision. A campaign, a product launch, and a full operating year may each require a different analysis.
📏 The Relevant Range Assumption
Break-even formulas assume price, unit variable cost, and total fixed costs remain stable within a defined relevant range of activity. Real operations eventually cross thresholds.
A factory may need another supervisor after a capacity limit, a retailer may receive bulk discounts, or a service firm may need new software licenses when it adds staff. These changes create step costs or altered unit economics.
Use ranges rather than pretending one equation works indefinitely. If capacity changes at 1,000 units, calculate one break-even model below that point and another for the expanded capacity scenario.
🚧 Capacity Can Make Break-Even Impossible
A calculated break-even volume must be compared with actual capacity. If a salon needs 650 appointments per month to break even but can schedule only 500 with its current staff and hours, the model reveals a structural problem.
The practical choices are to increase price, improve contribution margin, reduce fixed costs, add capacity, redesign the service, or reconsider the offering. Simply setting a target above capacity does not solve the gap.
This is one reason break-even analysis belongs alongside operational planning, not only in an accounting spreadsheet.
🔍 Use Sensitivity Analysis Instead of One “Perfect” Answer
Inputs are estimates. Materials costs, discount rates, returns, and customer demand can all differ from plan. Sensitivity analysis tests how the result changes under several reasonable assumptions.
For example, calculate break-even under a base case, a lower-price case, a higher-variable-cost case, and a lower-volume case. The purpose is not to forecast every possibility; it is to identify which assumptions matter most.
- If a small change in ingredient cost sharply raises break-even volume, purchasing risk deserves attention.
- If a modest discount makes the target unattainable, discount approval needs discipline.
- If capacity is close to break-even volume, staffing and scheduling flexibility become critical.
📉 Discounts, Returns, and Allowances Affect Realized Price
List price is often not the price a business truly earns. Volume discounts, coupons, refunds, loyalty rewards, sales returns, and sales commissions can reduce realized revenue or contribution.
Use an expected net selling price when these items are routine. For instance, a $100 list price is not a $100 contribution base if typical discounts reduce average collected revenue to $92.
Ignoring these reductions creates an optimistic break-even estimate. The error can be especially significant in industries with frequent promotions or return rights.
👥 Labor Classification Requires Care
Labor can be fixed, variable, or mixed depending on the arrangement. A salaried manager is generally fixed within a period. A worker paid per item assembled is variable. Hourly staff with minimum scheduled shifts may contain both elements.
Do not classify labor by job title alone. Ask whether the total labor cost changes when one additional unit is sold, and whether staffing changes occur in steps rather than smoothly.
For service businesses, labor decisions often dominate the model because service capacity cannot always be stored for later sale.
🧠 Common Break-Even Mistakes
Many errors arise not from arithmetic but from weak assumptions. A spreadsheet can calculate precisely from inputs that do not represent reality.
- Using revenue as if it were profit: sales must first cover variable and fixed costs.
- Leaving out “small” variable costs: payment fees, waste, fulfillment, and commissions can accumulate.
- Calling every payroll cost fixed: some payroll follows activity or changes in staffing steps.
- Ignoring sales mix: a multi-product average changes when customer choices change.
- Forgetting capacity: a required volume has no value if operations cannot deliver it.
- Treating the result as permanent: price, cost, and overhead assumptions need regular review.
🛠️ A Practical Break-Even Workflow
A sound process is simple, but it benefits from documented assumptions. Start with the decision you are trying to support: pricing a new service, setting a sales target, adding a location, or assessing a product line.
- Choose a time period and define the product, service, or sales mix.
- List costs and classify them by behavior within the expected activity range.
- Estimate net selling price and variable cost per unit.
- Calculate contribution margin and contribution margin ratio.
- Calculate break-even volume, break-even revenue, and target-profit volume.
- Compare results with demand estimates, capacity, cash needs, and alternative scenarios.
- Update the model when key assumptions change.
Documenting the assumptions makes review possible. It also lets other decision-makers challenge a number constructively rather than debating a hidden calculation.
💻 Building the Model in a Spreadsheet
A spreadsheet makes it easy to update inputs and test scenarios. Keep assumptions separate from calculations so users can see what drives the output.
A practical layout includes cells for fixed costs, list price, discounts, variable cost categories, contribution margin, expected sales volume, capacity, and target profit. Add a scenario area rather than overwriting the base case.
Useful outputs include break-even units, break-even sales, margin of safety, and estimated operating profit at several sales levels. Simple charts can help, but the underlying assumptions deserve more scrutiny than the visual design.
🧾 Break-Even Is Not the Same as Cash Break-Even
Standard break-even analysis commonly uses accounting costs, which may include noncash expenses such as depreciation. A business can therefore reach accounting break-even while still facing a cash shortage because of loan principal payments, inventory purchases, tax timing, or slow customer collections.
Cash break-even focuses on cash inflows and cash outflows. It can be useful for short-term liquidity planning, but its treatment of noncash costs differs from an operating-profit model.
Use both perspectives when needed. Profitability answers whether the model creates economic earnings; cash planning answers whether the business can pay obligations when due.
🗣️ How Managers Should Communicate the Result
“We need 300 units to break even” is incomplete without context. A useful communication states the period, the sales mix, the price assumption, the main variable costs, and whether 300 units are feasible.
For example: “At an average net price of $80, variable cost of $44, and monthly fixed costs of $10,800, we need 300 meal plans monthly. This assumes current delivery costs and no additional kitchen capacity.”
That sentence turns a raw number into a decision-ready statement and makes its limitations visible.
🔄 When to Recalculate Break-Even Point
Revisit the model whenever a key driver changes. A new lease, supplier increase, compensation plan, pricing change, promotional policy, capacity expansion, or product-mix shift can alter the threshold.
Regular review is particularly useful when costs are volatile or a business is growing quickly. The goal is not constant recalculation for its own sake; it is ensuring decisions use current economics rather than outdated assumptions.
A monthly review may suit a stable small operation, while fast-moving businesses may monitor contribution economics more often.
🌟 The Core Principle to Remember
Break-even analysis is built on one powerful idea: every sale produces a contribution margin, and the business must accumulate enough contribution margin to cover fixed costs.
Its central formula is straightforward:
Break-even units = Fixed costs ÷ (Selling price per unit − Variable cost per unit)The insight is broader than the formula. Profitability depends not on sales volume alone, but on the relationship among price, variable cost, fixed-cost commitments, product mix, and capacity. A high-sales business can lose money; a lower-volume business with strong contribution and controlled overhead can succeed.
Break-even analysis does not replace judgment, but it gives judgment a disciplined numerical starting point. When assumptions are realistic and regularly reviewed, it helps convert ambition into an achievable operating plan. 💰📊