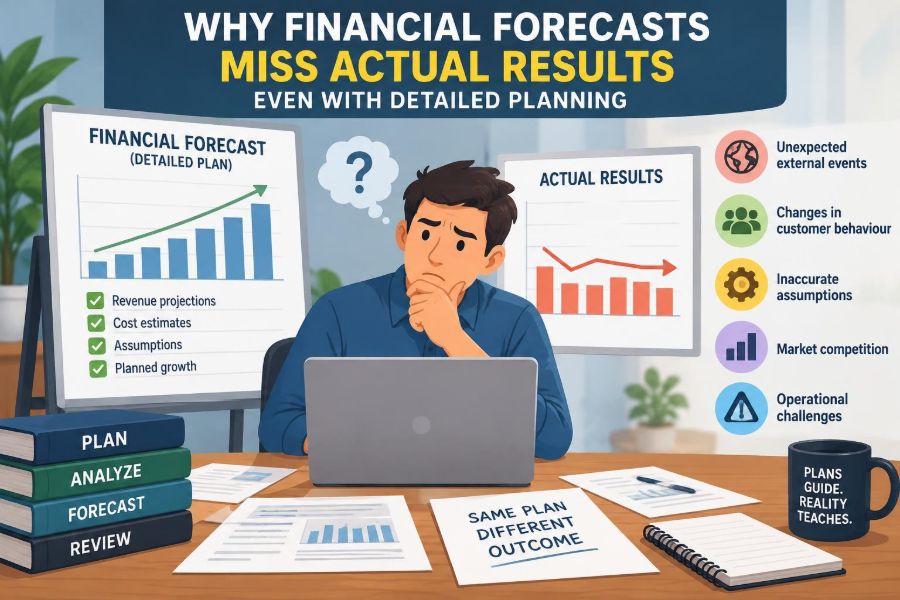

A management team approves a detailed annual forecast. Revenue is mapped by month, hiring is scheduled, marketing spend is assigned, and cash balances appear manageable. Six months later, actual performance tells a different story: sales arrived late, costs rose faster than expected, and the carefully built plan no longer explains what happened.
This is a familiar experience in businesses of every size. A missed forecast does not automatically mean the finance team was careless or that planning was pointless. It often means the forecast treated an uncertain operating environment as if it were more stable, measurable, and controllable than it really was.
Forecasts matter because they influence hiring, inventory, borrowing, investment, pricing, and performance conversations. When their limits are misunderstood, leaders can make confident decisions on fragile assumptions.
The goal is not to predict one perfect future. It is to understand why forecast error occurs, identify it early, and build a planning process that supports better decisions when reality changes.
🧭 A Forecast Is a Decision Model, Not a Promise
A financial forecast translates assumptions about customers, operations, prices, costs, timing, and financing into expected financial statements. It is a model of a possible future, not a contractual commitment from the future.
Detailed schedules can create a false sense of certainty. A workbook may show revenue to the nearest dollar, but its precision comes from formulas; it does not prove that demand, conversion rates, or delivery dates are known with the same precision.
The useful question is not “Was the forecast right?” but “Were the assumptions reasonable, visible, and responsive to new evidence?”
🎯 Detail Does Not Remove Uncertainty
Planning teams sometimes respond to uncertainty by adding more rows, product categories, and monthly allocations. Detail helps when it reflects real business drivers. It hurts when it merely distributes an unsupported total across many cells.
For example, forecasting revenue separately by region and salesperson is valuable if management understands pipeline quality, capacity, and sales-cycle differences. Assigning each person a smooth monthly growth rate without such evidence only makes an estimate look more authoritative.
Accuracy improves through better inputs and causal logic, not through spreadsheet complexity alone.
🔗 Small Assumption Errors Compound
Financial outcomes are connected. A modest error in customer acquisition can reduce revenue, delay collections, alter staffing utilization, increase the cost per sale, and tighten cash. Each downstream line may then miss for a different immediate reason, even though the original driver was demand.
Compounding is especially visible in growth plans. If revenue is expected to grow because leads, conversion, average order value, and retention all improve, the plan depends on several assumptions being achieved together.
- A lead shortfall reduces the available sales opportunity.
- A conversion shortfall reduces booked revenue from that opportunity.
- A retention shortfall reduces recurring revenue and lifetime value.
Reviewing the driver chain prevents teams from treating each variance as an isolated surprise.
📅 Timing Errors Can Look Like Performance Errors
A forecast may be directionally sound for the year and still miss every quarter because timing was wrong. A contract that closes in January rather than December, a shipment delayed by two weeks, or an invoice issued after month-end can materially change reported results.
Timing matters differently across the income statement, balance sheet, and cash flow statement. Revenue recognition, billing, customer payment, supplier payment, and cash collection may occur in different periods.
When management says, “The deal is coming,” finance should clarify which event is expected: signature, delivery, revenue recognition, invoice, or cash receipt.
🧾 Revenue Recognition Is Not the Same as Sales Activity
Commercial teams often describe performance through bookings, orders, or signed contracts. Financial reporting may recognize revenue only as goods are delivered or services are performed. A forecast built from sales activity but compared with recognized revenue will create predictable confusion.
Consider a hypothetical consulting engagement signed in March and performed evenly from April through September. The booking may be visible in March, but revenue is generally earned over the service period. Cash may arrive on yet another schedule.
Forecast models need explicit bridges between bookings, backlog, delivery, revenue, billings, receivables, and cash.
🧠 Optimism Bias Enters Before the Model Opens
People naturally emphasize opportunities they can see and underestimate obstacles that have not yet appeared. In planning, this can mean assuming new products launch on time, sales reps become productive quickly, customers renew, and cost savings arrive without disruption.
Optimism is not dishonesty. It often reflects incentives, personal ownership, or incomplete feedback from prior plans. But a budget process that accepts only ambitious assumptions can turn hope into an operating baseline.
A practical countermeasure is to ask each owner what would have to be true for the target to occur, what could prevent it, and which evidence supports the estimate.
🏷️ Targets and Forecasts Serve Different Purposes
A target is often aspirational: it communicates the level of performance an organization wants to achieve. A forecast is an estimate of what is currently most likely to happen given available evidence. Combining them can make both less useful.
If managers feel that a lower forecast will be judged as weak commitment, they may continue reporting the target as the forecast. Leaders then lose early warning signals and have less time to adjust spending, capacity, or financing.
| Planning tool | Primary question | Main use |
|---|---|---|
| Target | What do we aim to achieve? | Direction and accountability |
| Budget | What resources are authorized? | Allocation and control |
| Forecast | What is likely under current conditions? | Decision-making and early warning |
📈 Pipeline Quality Is Often Overstated
A sales pipeline is not revenue; it is a collection of possible opportunities at different stages and levels of evidence. Forecasts miss when every opportunity is treated as equally likely or when historic conversion rates are applied without considering deal quality.
Large deals deserve separate judgment. Their timing and probability can dominate a period, yet they may depend on procurement approval, customer funding, legal review, or a decision-maker who has not engaged.
Useful pipeline reviews distinguish between quantity of opportunities and quality of evidence supporting a close.
🛒 Customer Behavior Changes Faster Than Annual Plans
Customers can delay purchases, change product mix, reduce usage, negotiate terms, or leave because of factors outside a company’s control. An annual forecast may assume a stable buying pattern that was true when the plan was made but no longer describes current demand.
Recurring-revenue businesses face a related issue: a healthy renewal rate can conceal lower expansion, downgrades, or weaker new customer additions. Product businesses may see the same total units but a shift toward lower-margin items.
Forecasts should monitor leading indicators such as inquiries, usage, churn signals, quote activity, and order patterns rather than waiting for revenue to miss.
🏭 Operational Constraints Limit Financial Ambition
Revenue plans sometimes assume that capacity will appear when demand does. In practice, production capacity, implementation teams, support staffing, warehouse space, and supplier availability can constrain what can be sold and delivered.
A company might have enough customer demand for a new service but lack trained staff to implement it. The revenue shortfall is then operational, not commercial, and overtime or subcontracting can also push costs above plan.
Link operational measures directly to financial drivers: units per worker, lead time, utilization, yield, service capacity, and inventory availability.
🚚 Supply Disruptions Alter Cost, Volume, and Timing
Supplier delays can reduce available inventory, postpone customer deliveries, require expedited freight, or force purchases from higher-cost alternatives. One disruption can therefore affect revenue, gross margin, working capital, and customer relationships.
Detailed procurement plans are vulnerable when they assume a single delivery date, one supplier, or unchanged input prices. This is not an argument for assuming disaster; it is an argument for identifying concentration and contingency risks.
Critical items may warrant scenario assumptions for longer lead times, minimum stock levels, alternative sourcing, or delayed production.
💱 Prices, Rates, and External Conditions Move
Inflation, exchange rates, interest rates, commodity inputs, regulation, and competitor actions can change the economics of a plan. Their impact depends on contract terms, pricing power, inventory timing, debt structure, and customer sensitivity.
For example, a foreign-currency cost may rise in home-currency terms before the business can reprice customers. A forecast that holds both purchase costs and selling prices constant may miss margin even if sales volume is achieved.
External variables should be documented as assumptions, with sensitivity estimates where exposure is material.
👥 Hiring Plans Rarely Follow a Straight Line
Headcount forecasts commonly assume people start exactly when planned and become fully productive immediately. Recruiting delays, offer declines, onboarding, training, attrition, and changing skill needs make that unlikely.
The financial effect can go in either direction. A delayed hire may temporarily lower payroll but restrict sales or delivery; an urgent contractor may fill capacity but cost more than the planned employee.
Separate approved roles, expected start dates, fully loaded cost, and productivity ramp. Treat them as distinct assumptions rather than one headcount number.
🧮 Variable Costs Are Often Modeled as Fixed Ratios
Models frequently apply one gross-margin percentage or one operating-cost ratio to all forecast revenue. That shortcut can fail when product mix, customer mix, volume tiers, commissions, freight, returns, or overtime change.
Some costs are step-fixed: they stay stable within a range, then jump when another supervisor, shift, server tier, or facility is needed. A smooth percentage cannot capture that threshold.
Where practical, forecast costs from operational drivers such as units shipped, service hours, transactions, active users, or commissionable bookings.
📦 Working Capital Is Easy to Underestimate
A profitable forecast can still create a cash problem. Growth may require inventory purchases, deposits, payroll, or implementation work before customers pay. Receivables, inventory, and payables are collectively called working capital because they tie up or release cash during normal operations.
A company can miss cash forecasts even when its income statement forecast is close. The likely cause may be slower collections, earlier supplier payments, inventory buildup, or billing delays—not poor profitability.
Cash forecasting should use realistic payment behavior, credit terms, billing milestones, tax dates, and debt-service schedules.
🏦 Financing Assumptions Can Be Fragile
Plans sometimes assume that a credit facility will be available, investors will provide capital, or refinancing will close on a particular date. Until funding is committed and accessible, it remains an assumption with timing and condition risk.
Financing also has a cost. Interest expense may change with borrowing levels or variable rates, while loan covenants can limit actions when results deteriorate.
Model liquidity separately from profitability, and identify the point at which management needs a financing decision rather than simply hoping cash arrives.
🗂️ Bad Data Produces Plausible but Wrong Outputs
Forecasts depend on source data from accounting systems, customer relationship management tools, payroll records, inventory platforms, and operational reports. If those sources use different customer names, dates, definitions, or statuses, a model can reconcile internally while misrepresenting the business.
Common problems include duplicate opportunities, stale pipeline stages, unrecorded purchase commitments, incorrect revenue classifications, and actuals loaded with a delay. The problem is not always a dramatic error; small inconsistencies can distort trend assumptions.
Data ownership, reconciliations, and clear definitions are core forecasting controls, not administrative extras.
🧩 Model Design Can Hide the Real Drivers
A poorly designed model may bury assumptions in formulas, use hard-coded values, link periods incorrectly, or calculate totals before underlying drivers are reviewed. These weaknesses make updating slow and make errors hard to detect.
Strong models separate inputs, calculations, and outputs. They also make key assumptions visible: price, volume, conversion, headcount, payment days, cost rates, and timing.
Simple checks help: compare margin trends, test whether the balance sheet balances, verify cash roll-forwards, and ask whether changes in drivers produce sensible changes in results.
🔄 Annual Budgets Become Stale
An annual budget is useful for resource allocation, but it is usually built with information available months before the year begins. By midyear, customer conditions, staffing, and costs may have changed substantially.
Continuing to use an old budget as the only view of the future turns planning into a scorekeeping exercise. The budget still explains approved intent, but it may no longer support operating decisions.
A rolling forecast updates the outlook over a continuing horizon, such as the next several quarters, while preserving the original budget for comparison and accountability.
🧪 One Scenario Is Not Risk Management
A single “best estimate” forces uncertainty into one number. Scenario planning instead asks what results would look like if a few critical drivers moved differently. It is most useful when scenarios are plausible, distinct, and tied to actions.
Useful scenario structure
- Base case: the most supportable current view.
- Downside case: slower demand, delayed collections, weaker margins, or another defined pressure.
- Upside case: stronger conversion, faster delivery, or a specific favorable development.
The purpose is not to pick the most attractive case. It is to know which decisions are safe across cases and which require trigger-based responses.
📏 Leading Indicators Provide Earlier Warnings
Financial statements are essential, but they are often lagging indicators: they record effects after activity has occurred. Leading indicators provide earlier evidence of whether forecast assumptions are holding.
Relevant indicators differ by business. They may include qualified pipeline creation, website conversion, trial activation, backlog coverage, supplier lead time, employee turnover, delivery milestones, aged receivables, or customer usage.
An indicator is valuable only if there is a credible link to a financial outcome and someone reviews it often enough to act.
🔍 Variance Analysis Must Explain, Not Merely Report
A variance is the difference between actual and planned results. Saying that revenue was below budget identifies the symptom, not the cause. Useful analysis separates price, volume, mix, timing, foreign exchange, and one-time items where relevant.
For a missed sales forecast, a management explanation might distinguish fewer qualified leads, lower conversion, delayed close dates, and lower average selling price. Each cause calls for a different response.
Good variance analysis creates a feedback loop: it improves the next forecast and tests whether the business team’s explanation was accurate.
🗓️ Forecast Cadence Should Match Volatility
A stable business with predictable contracts may not need the same update frequency as a fast-growing company with short sales cycles and volatile input costs. Forecasting too rarely leaves decisions unsupported; forecasting too often can consume time without adding insight.
Many organizations benefit from a regular monthly process with more frequent cash or sales updates during periods of stress or rapid change. The key is a defined calendar, current actuals, clear owners, and a decision meeting.
Speed matters, but a rushed forecast based on unreconciled data can be less useful than a slightly later, reliable view.
🤝 Cross-Functional Ownership Improves Assumptions
Finance can challenge assumptions and integrate the numbers, but it cannot observe every customer conversation, production bottleneck, hiring constraint, or supplier issue. Forecast quality improves when sales, operations, HR, procurement, and finance share responsibility for their drivers.
That does not mean every department should submit an unchallenged wish list. Finance should create consistent definitions, test arithmetic and history, surface dependencies, and document decisions.
Operational ownership plus financial discipline produces a more useful forecast than either one alone.
🧱 Accountability Must Not Punish Honest Updates
If a forecast update is treated as an excuse rather than new information, people may delay bad news, defend outdated numbers, or add unexplained cushions. The organization then receives a comforting forecast and an unpleasant surprise.
Leaders can improve candor by distinguishing between accountability for execution and accountability for reporting. Missing a target requires learning and action; reporting a credible risk early should be encouraged.
Forecast review meetings work best when they ask, “What changed, what evidence supports it, and what decision follows?”
🛠️ Build an Assumption Register
An assumption register is a simple record of the inputs that matter most, their owner, source, date of update, confidence level, and financial impact. It turns hidden judgment into something that can be challenged and monitored.
A useful register might include expected conversion rate, launch date, average payment days, commodity-cost exposure, planned hires, and renewal assumptions. Each item should state the evidence behind it and the signal that would cause a revision.
This practice is especially valuable during handovers, because it preserves why a number was used rather than leaving only the number itself.
✅ Use Controls Without Freezing the Process
Forecasting needs controls: version management, approval of key assumptions, reconciliations to actuals, change logs, and review of major manual adjustments. These controls protect credibility and reduce accidental errors.
However, excessive approval layers can make the forecast too slow to reflect conditions. Match control intensity to materiality. A small travel variance does not need the same scrutiny as a large revenue-recognition assumption or financing requirement.
The aim is a controlled process that remains adaptable, not a locked spreadsheet that becomes obsolete.
🚦 Turn Forecasts Into Decision Triggers
The most mature forecast is connected to predetermined actions. If cash falls below a defined buffer, management may accelerate collections, pause discretionary spending, or discuss funding options. If pipeline coverage falls, sales capacity or marketing plans may be reconsidered.
Triggers should not be automatic punishments. They are prompts to investigate and decide, because metrics can move for temporary or unusual reasons. Still, agreeing on them before pressure rises reduces delay and debate.
This turns forecasting from a reporting ritual into an operating tool.
🌱 Forecast Accuracy Is a Learning System
Forecast improvement comes from repeatedly comparing assumptions with outcomes. Which sales stages were over-weighted? Which cost drivers were stable? Did collections follow terms? Did new hires ramp as expected? These questions make uncertainty more measurable over time.
Track errors at the level where decisions are made, not only at the consolidated total. A company could hit total revenue while repeatedly missing product mix, gross margin, and cash timing—errors that still matter greatly.
Do not expect uncertainty to disappear. Expect the organization to become better at recognizing, quantifying, and responding to it.
🏁 The Core Principle: Plan Precisely, Adapt Honestly
Financial forecasts miss actual results because businesses operate through changing customers, people, systems, markets, and timing. Detailed planning is valuable when it exposes the drivers and dependencies behind a number; it is misleading when it disguises uncertainty with elaborate formatting.
The strongest process combines a transparent driver-based model, current operational evidence, realistic scenarios, disciplined variance analysis, and a culture that rewards early updates. It recognizes that precision in presentation is different from certainty in the future.
When a forecast changes, the right response is not automatically to defend it or discard planning. It is to ask what changed, what that means for cash and operations, and what decision is now required.
A reliable forecast is not the one that claims to know the future; it is the one that helps people make better choices as the future unfolds. 📊💡🚀