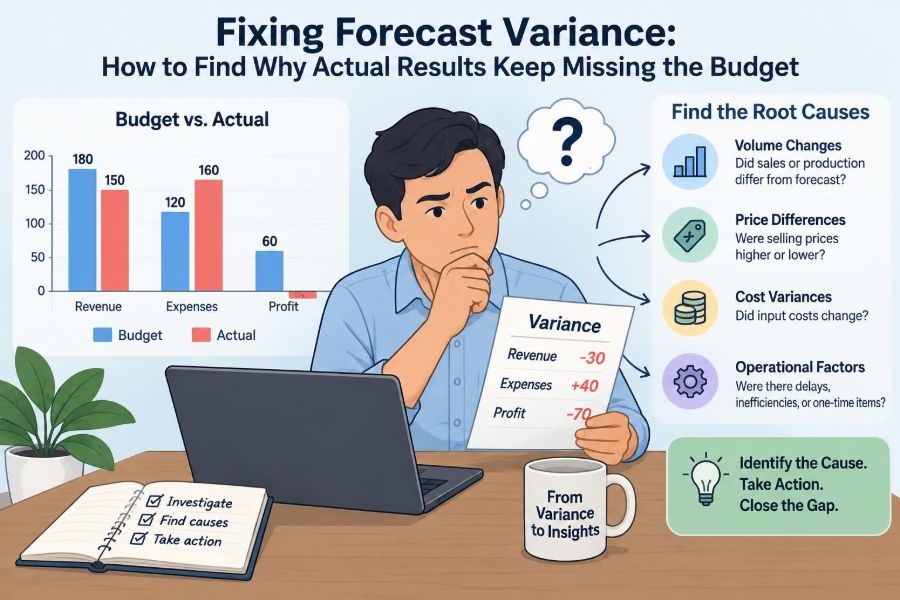

Monday morning arrives with a familiar frustration: revenue was below plan, payroll was above it, and the operating margin is nowhere near the number shown in the budget presentation. The finance team can explain the difference, but the explanation is often a list of unfavorable lines rather than a useful diagnosis.
That distinction matters. A variance report tells you where actual results differed from budget. Forecast variance analysis should help leaders understand why they differed, whether the cause will continue, and what should change next.
Without that discipline, organizations repeat a costly cycle: build a detailed annual budget, compare it with actuals each month, explain surprises after the fact, and miss the same drivers again in the next forecast.
Finding the reason behind a miss is less about producing more reports and more about connecting financial outcomes to the operating decisions and assumptions that created them. That is the core of useful accounting engineering.
🧭 Start with the meaning of variance
A variance is the difference between an expected result and an actual result. In its simplest form, it is actual minus budget, although whether a positive number is good or bad depends on the account.
For revenue, actual revenue below budget is generally unfavorable. For most expenses, actual expense above budget is unfavorable. For a cash balance, the interpretation depends on the business context and planned use of cash.
A variance is not automatically an error or a management failure. It is a signal that an assumption, timing expectation, measurement method, or business condition did not match reality.
🎯 Separate budget variance from forecast error
Budget and forecast are often used interchangeably, but they answer different questions. A budget is usually a target and resource-allocation plan approved for a fixed period. A forecast is management’s current best estimate of where results will land.
A business can miss budget while having an accurate recent forecast. For example, a customer cancellation in April may make the annual budget unrealistic; updating the forecast in May may be responsible management, not lowering the bar.
Forecast error measures the gap between a prior forecast and the eventual actual result. When actual results keep missing the budget, examine both: was the original plan wrong, or did the organization fail to update its view as conditions changed?
🗺️ Define the comparison before diagnosing it
Many weak explanations begin with an inconsistent comparison. A monthly actual may be compared with an annual budget divided by twelve, even though the budget assumed seasonal demand, milestone billing, or a specific hiring date.
Before investigating, state the exact comparison in plain language: “May actual product revenue versus the approved May budget,” or “year-to-date actual labor cost versus the latest quarterly forecast.”
Also confirm the reporting basis. Cash-basis activity and accrual-basis financial results can move in different months. A meaningful investigation requires comparable periods, entities, currencies, account mappings, and accounting policies.
🧮 Confirm the data before explaining the business
Do not begin by asking sales or operations to explain a number that may be incomplete. Close adjustments, late invoices, misclassified expenses, duplicate entries, intercompany eliminations, and incorrect allocations can all create apparent variance.
A practical first pass includes checking whether actuals reconcile to the general ledger, whether the budget version is the approved version, and whether significant manual journal entries were posted after the usual close process.
This is not a reason to delay operational inquiry indefinitely. It is a safeguard against spending hours explaining a “sales decline” caused by a credit note posted to the wrong department.
🔎 Set a materiality threshold
Not every difference deserves the same level of analysis. A small variance may be ordinary noise, while a modest currency change in a highly sensitive business may deserve attention because it affects future decisions.
Materiality is therefore both quantitative and qualitative. Consider the size of the variance, its percentage of the budget line, whether it changes a key decision, whether it repeats, and whether it indicates a control or compliance issue.
- Investigate large dollar differences that affect profit, cash, or covenant headroom.
- Investigate large percentage differences in small but strategically important accounts.
- Escalate recurring small variances when they point to a consistently broken assumption or process.
A clear threshold focuses management discussion on drivers rather than forcing every account owner to invent a story for immaterial rounding differences.
📊 Use a variance bridge, not just a list of accounts
A list of favorable and unfavorable accounts describes the final accounting result. A variance bridge organizes the movement into drivers that explain how the organization traveled from budgeted profit to actual profit.
For a retailer, the bridge may move through sales volume, selling price, discounting, product mix, cost of goods, store labor, and overhead. For a consulting firm, it may move through billable headcount, utilization, billing rates, subcontractor use, and project write-offs.
The bridge forces a useful question: what operational lever changed? “Revenue was unfavorable” is an outcome. “Customer orders were below plan in two regions, partly offset by a better product mix” is a diagnosis.
🧩 Break revenue into price, volume, and mix
Revenue variance often becomes clearer when separated into price, volume, and mix. Price reflects the amount earned per unit; volume reflects units sold or delivered; mix reflects the changing proportion of products, customers, channels, or services.
Consider a hypothetical manufacturer that budgeted 10,000 units at $100 each. It sells 9,000 units, but at an average realized price of $105. The lower volume is unfavorable, while price is favorable. The net revenue result can conceal both movements.
Mix requires care. A company may meet its total sales target by selling more low-margin products and fewer high-margin products. Revenue looks healthy, but gross profit and capacity use may not.
🛒 Look beyond booked sales
Booked sales are not always the best operating measure. Depending on the business, a revenue miss may begin earlier in the funnel: website traffic, qualified leads, conversion rates, renewals, customer churn, shipment capacity, implementation completion, or invoice acceptance.
For subscription businesses, distinguish new sales from retention. For project businesses, distinguish signed work from work that can actually be delivered and recognized under the organization’s revenue policy.
Finance should not replace the commercial team’s analysis. Its role is to connect leading operational measures with the financial outcome and test whether the revenue forecast has a credible path to delivery.
🏭 Analyze direct costs with the revenue driver
Direct costs should usually be analyzed alongside the related revenue. If revenue fell because units sold were lower, some variable materials, commissions, shipping, or transaction fees should also fall. If they did not, the issue may be purchase commitments, minimum charges, waste, or poor cost classification.
For example, lower sales may appear to improve material cost because fewer inputs were consumed. Yet a supplier price increase or production scrap can erase that benefit. A single gross-margin percentage rarely explains which force mattered.
Linking revenue and direct costs prevents a common mistake: celebrating a favorable cost variance that is merely the consequence of missed demand.
👥 Separate staffing rate, headcount, and timing effects
Payroll frequently misses budget for reasons that need to be separated. Headcount can differ from plan, average pay can differ from plan, overtime can rise, contractor spending can substitute for employees, and start dates can move between months.
A department may report lower payroll than budget because planned hires started late. That is favorable in the current month, but it may be unfavorable operationally if delivery capacity, customer service, or control quality has suffered.
Use a workforce bridge that identifies planned versus actual headcount, vacancies, hires, exits, compensation changes, overtime, bonuses, and contractor equivalents. This gives leaders a clearer picture than a single salary expense line.
⏱️ Identify timing differences before calling them performance
Timing variance occurs when an event happens earlier or later than budgeted, without necessarily changing the full-year result. A delayed marketing campaign, annual software renewal, inventory receipt, or project milestone can create a large monthly difference.
Timing is not harmless by default. A delay can become a permanent miss if a postponed hire never starts, a customer project slips into the next year, or an unspent maintenance budget produces future operating risk.
Label timing explicitly and ask two follow-up questions: when will the item reverse, and what evidence supports that expectation? “Expected next month” is not a sufficient forecast assumption on its own.
📅 Account for seasonality and calendar effects
Monthly plans need to reflect the calendar through which the business operates. Retail trading days, holidays, weather patterns, school schedules, fiscal-quarter buying behavior, and billing cycles can materially change the expected pattern of activity.
Even the number of workdays matters in labor-intensive businesses. Comparing a four-week month with a five-week month without adjusting the activity base can create a misleading productivity conclusion.
Seasonality should be embedded in the budget and forecast, not added as a vague explanation after results arrive. Where patterns are unstable, use ranges and scenario assumptions rather than pretending a single monthly number is certain.
🌍 Isolate currency, inflation, and external market movements
Some misses originate outside management’s direct control: exchange rates, commodity prices, interest rates, freight availability, or broad demand conditions. These factors still need a precise explanation rather than a catch-all label of “market conditions.”
Separate the effect of translating foreign operations into the reporting currency from the local-currency performance of those operations. Similarly, separate a supplier price increase from an increase caused by buying more units.
External drivers do not remove the need for action. They may require repricing, hedging decisions, supplier negotiations, revised purchasing plans, or a more conservative forecast range.
🏷️ Test whether cost allocations are distorting the story
Shared costs are often allocated to departments, products, or customers using drivers such as headcount, floor space, revenue, or transaction volume. These allocations can be useful for accountability, but they can also create confusing variance narratives.
If corporate IT cost is allocated by headcount, a department’s expense can rise even when its local manager made no spending decision. That is a real profitability effect, but not necessarily a local controllable-cost variance.
Present both views when needed: the full financial result and the controllable operating result. This protects accountability without hiding the total economics of the business.
🧾 Watch for accounting-policy and close-process effects
Some variance is created by the mechanics of accounting. Accrual estimates, inventory valuation, depreciation, bad-debt provisions, capitalization decisions, revenue recognition judgments, and reserve releases can move reported results between periods.
These entries may be entirely appropriate, but they need transparent treatment. A forecast should reflect known accounting consequences when they are reasonably estimable rather than treating them as unexpected finance adjustments at close.
When explaining a variance, distinguish between an underlying operating change and a reporting adjustment. Both affect the financial statements; only one may indicate a change in day-to-day performance.
🔗 Trace each major variance to a business driver
A useful analysis creates a line of sight from the financial account to the operating driver, source system, owner, and management action. This is more robust than attaching a narrative comment to a spreadsheet cell.
| Financial result | Likely operational drivers | Useful evidence |
|---|---|---|
| Revenue below budget | Volume, price, mix, churn, delivery timing | Orders, pipeline, renewal data, shipments |
| Labor above budget | Headcount, rates, overtime, contractors | Payroll file, roster, time records, hiring plan |
| Gross margin below budget | Input price, yield, discounting, mix | Purchase prices, production data, sales detail |
| Cash below budget | Collections, inventory, capital spending, payment timing | Aging reports, inventory records, payment schedule |
The point is not to create a perfect data model before acting. It is to ensure that explanations can be tested against observable evidence.
🧠 Ask “why?” repeatedly, but stop at actionable causes
The “five whys” technique can help move past superficial explanations. If revenue was low because orders were low, ask why orders were low. If conversion was low, ask why conversion fell. Continue until the organization reaches a cause that can be owned, monitored, or deliberately accepted.
Do not apply the method mechanically. A complex result can have several causes, and an answer such as “the market was weak” may be partly true but still incomplete.
A good root cause is specific enough to guide a response: “The budget assumed the new channel would launch in February, but contracting and product integration delayed launch until May.”
📝 Write explanations that can be challenged
Strong variance commentary is concise, quantified, evidence-based, and forward-looking. It identifies the driver, states the financial effect, explains whether the effect is temporary or recurring, and says what changes in the forecast.
Compare these statements:
- Weak: “Travel overspent due to business needs.”
- Better: “Travel exceeded budget because three unplanned customer implementation visits occurred after a project scope change. Two visits are complete; the remaining project travel is included in the revised forecast.”
The better version is not simply longer. It gives a reader enough information to test the claim and understand the next implication.
🔄 Refresh the forecast rather than defending the budget
Once a material driver changes, the forecast should be updated through the remaining periods. Holding the original annual budget constant may preserve a target, but it does not help leaders manage the likely outcome.
A forecast refresh should not blindly annualize one unusual month. Instead, update the drivers: expected units, pricing, hiring dates, utilization, supplier costs, collection timing, and planned actions.
The budget remains a valuable benchmark. The forecast becomes the decision tool for resourcing, liquidity, incentives, and risk management.
📈 Use run rates carefully
A run rate projects a current result forward, such as multiplying a month’s sales by twelve. It is fast and can reveal whether a plan is broadly off track, but it is often wrong when activity is seasonal, project-based, or affected by one-time events.
Use run rates as a diagnostic prompt, not as an automatic forecast. If current performance differs from plan, ask whether the underlying driver is stable, improving, deteriorating, or scheduled to reverse.
A business with a large annual renewal cycle, for instance, needs a renewal schedule and probability assessment—not a simple monthly average.
🌦️ Build scenarios around uncertain drivers
When uncertainty is real, a single-point forecast can create false confidence. Scenario planning describes different plausible paths based on defined assumptions, such as conversion rates, customer retention, commodity prices, or hiring timing.
Keep scenarios decision-oriented. A useful downside case answers what management would do if demand remains weak; an upside case tests whether capacity, inventory, and cash can support stronger demand.
Do not create dozens of lightly different cases. Focus on the few uncertainties that could materially change profit, cash, service levels, or strategic commitments.
💧 Connect profit variance to cash variance
Profit and cash are related but not identical. A business can meet its profit plan while missing cash targets because customers pay late, inventory grows, capital spending accelerates, or tax and debt payments occur earlier than expected.
When results miss budget, review working capital: accounts receivable, inventory, accounts payable, deferred revenue, and accrued expenses. A revenue shortfall may reduce receivables, while a collection problem can hurt cash without changing revenue at all.
Cash forecasting needs its own drivers and timing assumptions. Treating the income statement forecast as a cash forecast can leave a business unprepared for liquidity pressure.
🧑🤝🧑 Give owners responsibility for drivers, not just accounts
Account owners can explain what happened in their ledger lines, but operating leaders usually own the actions that produce those lines. Sales owns conversion and pricing discipline; operations may own throughput and waste; HR and department leaders influence staffing; finance owns process integrity and challenge.
Assign each material forecast driver an owner, a data source, an update frequency, and a clear decision right. This turns forecasting from a finance-only reporting exercise into a management process.
Accountability should not become blame. The aim is to surface changing information early enough to make better choices.
🗓️ Create a reliable monthly variance rhythm
A repeatable calendar improves both speed and quality. Close the books, validate major movements, collect explanations from driver owners, challenge assumptions, update the forecast, and take decisions while the information is still timely.
- Reconcile actual results and confirm the comparison basis.
- Rank material variances and identify preliminary drivers.
- Meet with operational owners using supporting evidence.
- Classify effects as recurring, timing-related, one-time, or uncertain.
- Update forecast assumptions and document management actions.
- Review risks, decisions, and owners with leadership.
Consistency matters more than a perfectly elaborate template. A routine that people trust will reveal patterns that ad hoc reporting misses.
🚫 Avoid common variance-analysis traps
One trap is treating favorable variance as automatically good. Underspending on maintenance, training, cybersecurity, or essential hiring can improve short-term results while increasing future risk.
Another is accepting generic explanations such as “timing,” “market conditions,” or “higher activity” without evidence. These phrases may be true, but they do not tell leaders whether to change the forecast or take action.
Also avoid excessive precision. A detailed spreadsheet cannot compensate for uncertain inputs. Where evidence is limited, identify the uncertainty openly and explain what will resolve it.
🧪 Use simple tests to challenge the forecast
Forecast review should include a few disciplined challenge questions. If sales are expected to recover, what pipeline stage movement, capacity, or customer commitment supports that recovery? If labor costs will fall, which roles will leave or which contractors will end?
Compare the forecast with independent indicators where possible: order backlog, delivery schedules, payroll rosters, purchase orders, customer aging, production plans, and contract renewal dates.
A forecast is stronger when the financial number agrees with operational reality. When they conflict, do not average them—investigate the assumption that is creating the mismatch.
⚖️ Balance detail with decision usefulness
More detail is not always better. A senior leadership team may need the five drivers changing full-year earnings and the decisions required, while a department manager may need a more granular view of labor, vendors, and activities.
Use a layered approach: a concise executive bridge, supporting driver analysis, and transaction-level evidence available for follow-up. This keeps meetings focused without sacrificing auditability.
The best level of detail is the level that changes a decision, reveals a risk, or verifies a claim. Everything else can remain available without dominating the discussion.
🛠️ Turn findings into operating actions
Variance analysis has limited value if it ends with explanation. Each significant recurring or controllable driver should lead to a response: revise pricing, accelerate collections, adjust purchasing, change hiring timing, renegotiate a contract, improve a process, or explicitly accept a risk.
Actions need dates and owners. “Reduce discretionary spend” is not an action plan; “pause nonessential travel approvals through the quarter, with the operations director reviewing exceptions weekly” is one.
Track whether the action changes the driver. If it does not, the organization has learned something useful: either the diagnosis was incomplete or the chosen response was insufficient.
🏁 Make variance analysis a learning system
The strongest organizations use misses to improve the next planning cycle. They track recurring forecast errors by driver, review assumptions after major deviations, and distinguish unforeseeable shocks from patterns that should have been visible.
This does not mean demanding perfect prediction. It means improving the quality of assumptions, recognizing uncertainty earlier, and responding before a monthly report becomes a postmortem.
The core principle is simple: trace each material financial variance to a specific driver, test the explanation with evidence, and update the forward view in time to act.
Actual results will never follow a budget perfectly. But when finance and operations investigate the mechanics behind each meaningful miss together, variance reporting becomes a practical tool for better decisions rather than a monthly exercise in explaining the past. 📊💡🤝