
It is late in the month, and a department leader asks a deceptively simple question: “Can we afford to hire one more person?” Finance has a budget spreadsheet, payroll has employee data, and operations has a forecast—but the figures do not quite match.
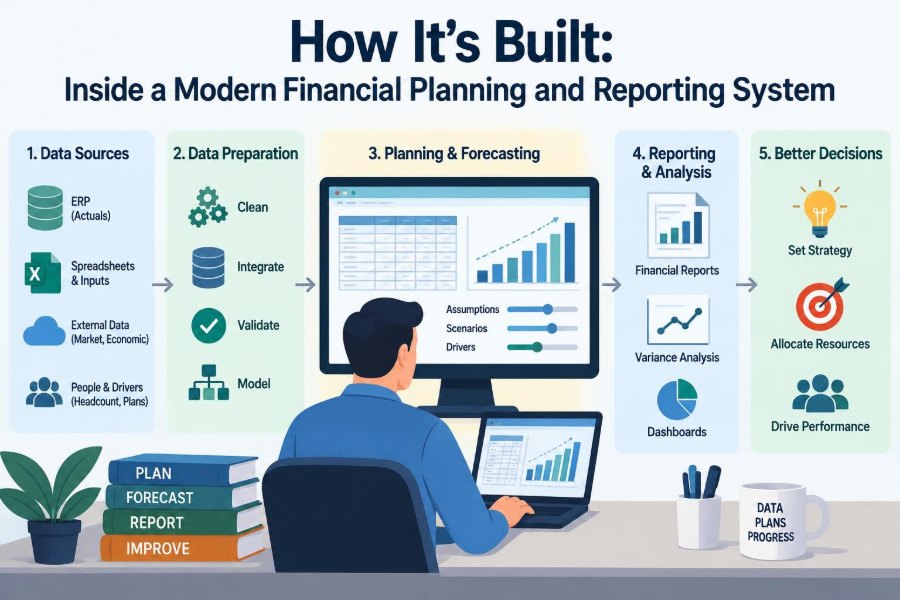
That gap is where financial planning and reporting systems earn their keep. A well-built system turns transactions, business assumptions, and operating activity into a shared view of what happened, what may happen next, and which decisions are realistic.
For students, this is a useful way to see how accounting concepts become working processes. For professionals, it explains why a clean report is rarely just a report: it is the visible end of a chain of data, controls, judgment, and communication.
Modern systems are not defined by a particular software brand. They are built from connected capabilities that make financial information timely enough to guide action and reliable enough to support accountability.
🏗️ The system is more than a dashboard
A financial planning and reporting system combines the people, processes, data, policies, and technology used to plan performance and explain results. Its outputs may include budgets, forecasts, management reports, statutory financial statements, and variance analysis.
A dashboard is only one interface. The underlying system must establish where figures came from, which rules transformed them, who reviewed them, and whether another person can reproduce the result.
🎯 Start with the decisions people need to make
Good design begins with decisions, not with a list of available data fields. Executives may need to decide whether to invest, managers may need to control spending, and lenders or owners may need evidence of financial health.
Each decision requires a different level of detail and timing. A weekly cash outlook supports payment decisions; a monthly margin report supports pricing or cost decisions; annual statements serve broader external accountability.
🧭 Separate planning, reporting, and analysis
These activities connect closely, but they are not interchangeable. Planning sets expectations and resource choices. Reporting communicates recorded and controlled results. Analysis investigates why outcomes differed and what action may follow.
Confusing the three creates weak conversations. A forecast is an estimate, not an actual result. A monthly report can reveal that sales declined, but analysis must determine whether the cause was volume, price, timing, customer mix, or a data error.
🧱 Build on a usable chart of accounts
The chart of accounts is the organized list of accounts used to classify financial transactions. It is the system’s shared vocabulary for assets, liabilities, revenue, expenses, equity, and often management dimensions such as department or project.
A chart that is too broad hides meaningful patterns. One that is too detailed burdens people with coding choices and makes reporting harder to maintain. The practical aim is stable categories that answer recurring questions without requiring unnecessary exceptions.
🏷️ Add dimensions without losing discipline
Dimensions are labels that let a business view the same transaction from several angles: cost center, product, customer group, location, legal entity, channel, or project. A marketing expense, for example, might be tagged to a region and a campaign.
Dimensions enable flexible reporting, but every added field needs a purpose, a definition, and an owner. If staff select inconsistent project codes, a polished project report can still be misleading.
🔌 Connect the operational source systems
Financial data often begins outside the general ledger. Sales systems record orders, payroll systems calculate wages, procurement systems capture purchase commitments, and inventory systems record movements and costs.
Integration reduces manual re-entry, but it does not automatically improve data quality. A system interface can transfer an incorrect customer category very efficiently. Teams need to understand the source, timing, and business meaning of every important feed.
📥 Create a controlled data intake process
Not every input arrives through an automated connection. Planning assumptions, accrual support, headcount plans, and some adjustments may arrive in templates or structured forms.
Controlled intake means using defined formats, validation checks, deadlines, and named preparers. It also means preserving the original support. A number copied into a model without its rationale is difficult to challenge later.
🧹 Treat master data as a financial control
Master data includes relatively stable records such as suppliers, customers, employees, account codes, cost centers, and product identifiers. These records determine how many transactions are classified and reported.
Duplicate suppliers can create payment risk. An inactive cost center used by mistake can distort accountability. Clear ownership, approval rules, and periodic review make master data a control activity rather than a background administrative task.
📚 The general ledger remains the accounting backbone
The general ledger collects accounting entries in a structured record. Subledgers, such as accounts receivable, accounts payable, fixed assets, and payroll, usually hold transaction detail and feed summarized entries into it.
For formal reporting, the ledger is often the controlled source of record. Planning tools may model an expected result, but final actuals should reconcile to the ledger after the close process.
🔄 Design a repeatable close calendar
The close is the sequence of procedures used to finalize a reporting period. It commonly includes posting transactions, reconciling accounts, recording accruals, reviewing results, consolidating entities, and approving reports.
A calendar assigns each activity an owner, due date, dependency, and review step. It makes bottlenecks visible: a revenue review cannot be completed if billing data has not been finalized.
✅ Reconciliations prove that records connect
A reconciliation compares two related records and explains or corrects differences. Examples include comparing bank records with the cash ledger, or a fixed asset register with the corresponding ledger balance.
Reconciliations are not merely a check-the-box exercise. They test completeness and accuracy. An unexplained difference may indicate a timing issue, an error, a missing entry, or—in more serious cases—an unauthorized transaction.
🧾 Use adjustments carefully and visibly
Adjusting entries recognize items in the appropriate period when ordinary transaction processing does not fully capture them. Common examples include depreciation, accrued expenses, prepaid expense amortization, and estimated obligations.
Because adjustments often depend on judgment, they need clear documentation and review. A strong workflow identifies the preparer, approver, supporting calculation, accounting rationale, and whether the entry should reverse in the next period.
🧮 Understand consolidation and eliminations
Organizations with multiple legal entities need to combine results into a group view. Consolidation translates local records into a common reporting structure and removes internal activity that should not inflate group revenue, expense, assets, or liabilities.
For example, a sale from one subsidiary to another is real in each entity’s books, but it is not external group revenue. Intercompany matching and elimination entries are therefore central to credible consolidated reporting.
📅 Build the budget as a coordinated model
A budget is a structured financial plan for a future period. It commonly links expected sales, staffing, operating costs, capital spending, funding needs, and cash movements.
It should not be a collection of independent departmental wishes. If a sales plan assumes higher volume, operations may require more labor or inventory, while finance may need to model the associated working-capital effect.
🔮 Forecast differently from the budget
Once a budget is approved, it often becomes a benchmark for accountability. A forecast should instead represent the best current estimate of the future, using actual results and updated assumptions.
A team that refuses to revise its forecast to avoid “missing budget” loses a valuable early-warning tool. Keeping budget and forecast separate allows leaders to see both performance against the original plan and the likely year-end path.
🌊 Use rolling forecasts when conditions change quickly
A rolling forecast extends a fixed planning horizon forward each cycle, such as maintaining the next twelve months of expected results. It helps organizations avoid concentrating all planning effort in a single annual event.
Rolling forecasts require discipline. Drivers, assumptions, and version dates must be clear, or frequent revisions can create confusion rather than insight. They are most useful when managers can actually respond to emerging changes.
⚙️ Model the drivers, not just the totals
Driver-based planning estimates financial outcomes from operational causes. Revenue might be modeled from customer volume, conversion rates, units, and price. Labor cost may stem from headcount, pay rates, start dates, and overtime assumptions.
Driver models make assumptions visible and easier to test. They do not eliminate judgment: the model is only as sensible as the operational relationship it represents.
📊 Make variance analysis explainable
A variance is the difference between actual and expected performance. The useful question is not only whether spending was above or below budget, but what created the difference and whether it will continue.
For a hypothetical retailer, sales could exceed plan because prices rose, units increased, or customers bought more premium items. Those causes imply different next steps, even when the total revenue variance is identical.
| Variance type | Question it helps answer | Typical response |
|---|---|---|
| Price | Did the amount charged or paid change? | Review pricing, contracts, or market costs. |
| Volume | Did quantities sold, produced, or used change? | Review demand, capacity, or usage. |
| Timing | Did activity move between periods? | Assess whether the effect will reverse. |
| Mix | Did the composition of activity change? | Review product, customer, or channel choices. |
💵 Put cash at the center of planning
Profit and cash are related but different. Revenue may be recognized before a customer pays, and an equipment purchase may consume cash without immediately appearing as a full expense.
A cash forecast therefore considers collection timing, supplier payments, payroll, taxes, debt service, capital expenditure, and financing. It is especially valuable where payment timing is uncertain or liquidity is tight.
🧠 Establish one version of the truth—with context
“One version of the truth” does not mean every team sees identical detail. It means core measures have agreed definitions, controlled sources, and consistent calculation logic.
For instance, a metric labelled “revenue” must specify whether it is gross or net, billed or recognized, actual or forecast, and whether it includes intercompany activity. Context prevents apparently conflicting reports from becoming arguments over terminology.
🔐 Build controls into the workflow
Internal controls are procedures designed to reduce the risk of error, loss, misuse, and unreliable reporting. Useful controls are embedded in normal work instead of appearing only at year-end.
- Approval thresholds for purchases and journal entries
- Segregation of duties between creating, approving, and paying transactions
- System access based on job responsibilities
- Exception reports for unusual values or missing information
- Evidence of review for key reconciliations and reports
Controls must be proportionate. An overly burdensome approval chain can encourage workarounds; a weak one may leave material activity unchecked.
🛡️ Protect sensitive financial information
Financial planning systems may contain payroll details, customer information, pricing, bank data, and strategic plans. Security therefore includes both technology and behavior.
Role-based access, multifactor authentication, audit logs, secure backups, and prompt removal of access after role changes are common safeguards. Teams should also consider who can download data, alter formulas, or view confidential scenario assumptions.
🧪 Test changes before they affect reporting
New account mappings, report formulas, integrations, and planning models can change outputs without obvious warning. A controlled change process documents what changed, who approved it, how it was tested, and how it can be reversed if needed.
Testing should use realistic cases, including exceptions. A report that works for ordinary transactions may fail when a new entity, currency, product, or negative balance appears.
🤖 Automate repeatable work, not unexplained judgment
Automation is well suited to recurring data loads, standard reconciliations, report refreshes, validation rules, and routine workflow reminders. It can shorten cycle time and reduce copying errors.
But automation does not remove accountability. An automated accrual based on a flawed assumption can repeat the same error every month. Human review remains necessary where estimates, unusual transactions, or changing business conditions matter.
🧑💼 Give every number an owner
Ownership should be explicit. Finance may own accounting policy and reporting integrity, while operational leaders own the assumptions and activities behind their areas. Technology teams may own access, integrations, and platform reliability.
A simple responsibility map prevents the familiar problem of everyone assuming someone else checked a critical number. Ownership also makes follow-up practical when an exception appears.
🗣️ Turn reports into management conversations
A report is useful when it prompts a decision or a focused question. Effective management reporting highlights material changes, explains drivers, identifies risks and opportunities, and states the action or decision required.
That does not mean hiding bad news. A concise report that clearly says “collections are slowing and the next-quarter cash outlook needs revision” is more valuable than a visually impressive pack with no interpretation.
🚧 Avoid common implementation mistakes
Many projects struggle because they treat the work as a software installation rather than an operating-model change. The same issue appears when teams automate inconsistent processes or migrate historical data without clear definitions.
- Copying old spreadsheets and labels without redesigning them
- Building too many measures before agreeing on the few that drive decisions
- Ignoring data ownership after the initial launch
- Training users only on clicks, not on concepts and controls
- Measuring success by go-live date instead of reporting quality and adoption
🪜 Improve in deliberate stages
A practical roadmap usually starts with a reliable close, reconciled actuals, and essential reports. Next come consistent planning templates, driver models, and forecast routines. More advanced analytics and automation can follow when foundations are stable.
This sequence may feel less exciting than a large transformation announcement, but it reduces risk. Fast reporting built on unreliable classifications simply produces unreliable answers faster.
📈 Measure whether the system is actually working
System quality can be observed through practical signals: how long close takes, how many late adjustments occur, how often reports need restatement, how quickly forecasts incorporate new information, and whether users trust the outputs.
No single measure tells the whole story. A very fast close is not a success if key reconciliations are skipped; an extremely detailed forecast is not useful if managers cannot understand or act on it.
🌱 Design for change, not permanent perfection
Businesses acquire products, open locations, enter contracts, change pricing, and face new reporting requirements. A durable financial architecture accommodates controlled change through flexible dimensions, documented definitions, maintained mappings, and regular governance.
The goal is not to predict every future requirement. It is to make future changes understandable, testable, and traceable rather than dependent on one person’s undocumented spreadsheet knowledge.
🔑 The core principle: trustworthy information supports better choices
A modern financial planning and reporting system connects operational reality to accounting discipline. It captures transactions carefully, closes them with evidence, models the future with explicit assumptions, and communicates results in a form that supports action.
Technology can accelerate each step, but the system’s real strength comes from consistent definitions, accountable owners, sound controls, and people willing to investigate what the numbers mean.
The best financial systems do not merely produce numbers—they create a reliable basis for deciding what to do next. When the underlying process is built with that purpose, reports become less of a monthly ritual and more of a practical management tool. 💰📊🧭