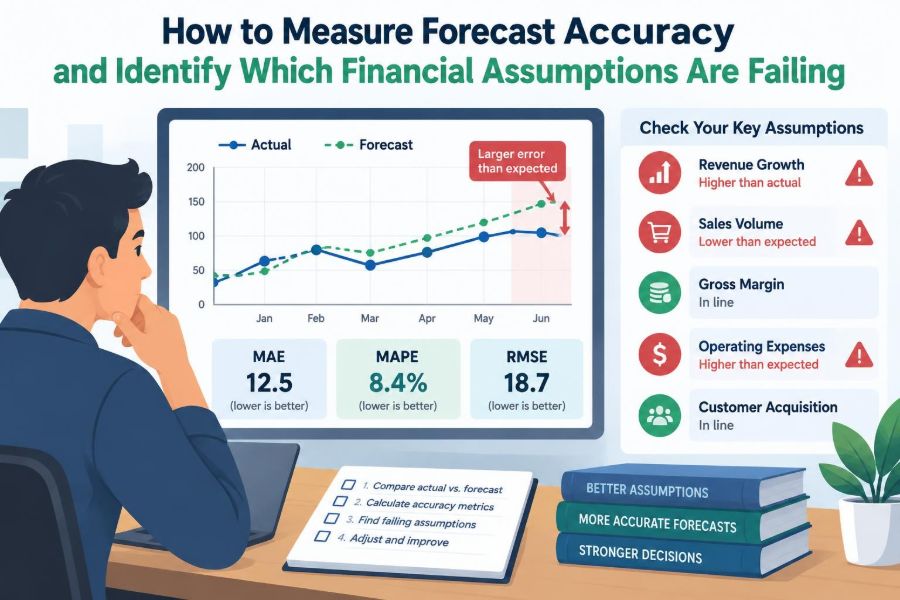

Your forecast says the quarter should close on plan. Sales leaders are confident, the hiring schedule has been approved, and cash appears adequate.
Then actual results arrive. Revenue misses, gross margin is thinner than expected, and operating expenses run ahead of budget. The immediate question is often, “Why was the forecast wrong?”
That question is useful, but incomplete. A forecast is built from many assumptions: volume, price, timing, conversion, staffing, payment behavior, inflation, and more. A single headline variance cannot reveal which one failed.
Measuring forecast accuracy well turns forecasting from a periodic prediction exercise into a learning system. It helps finance teams distinguish a bad model from a sound model facing unusual conditions—and it gives operators something specific to improve.
🎯 Forecast Accuracy Is More Than Being “Close”
Forecast accuracy describes how closely a forecasted value matches the actual outcome. It is usually expressed as an error amount, an error percentage, or a pattern of errors over time.
But “close” depends on the decision involved. A $50,000 revenue miss may be immaterial for a large enterprise yet decisive for a small business deciding whether it can make payroll. Accuracy must be assessed in the context of materiality, volatility, and the decision the forecast supports.
A useful accuracy process asks two questions: How large was the miss, and what produced it? The second question is where forecast review becomes financially valuable.
🧭 Start With the Decision the Forecast Supports
Forecasts serve different purposes. A weekly cash forecast supports liquidity management; a sales forecast informs capacity and inventory; an annual operating plan guides hiring and investment. Their acceptable error ranges should not be identical.
Define the decision before choosing the metric. For example, if management needs to know whether the company will breach a cash minimum, the direction and timing of error may matter more than a highly precise annual total.
- Cash forecasts: emphasize timing, downside risk, and upcoming commitments.
- Demand forecasts: emphasize units, mix, and operational capacity.
- Revenue forecasts: emphasize volume, price, renewals, and deal timing.
- Expense forecasts: emphasize fixed versus variable cost behavior and hiring timing.
📅 Compare Forecasts Made at the Same Point in Time
Forecast accuracy is easy to distort when teams compare actuals with the latest revised forecast. A forecast updated on the last day of the month may look excellent simply because it already incorporates most of the month’s result.
Instead, preserve a forecast vintage: the version available at a specified point before the actual period. A January forecast for March should be compared with March actuals, even if the forecast was revised in February.
Measure accuracy by forecast horizon as well. A one-month-ahead forecast answers a different question from a six-month-ahead forecast, and it should usually be more accurate.
🧮 Calculate the Basic Forecast Error
The simplest calculation is forecast error:
Forecast Error = Actual - ForecastIf actual revenue is $920,000 and forecast revenue is $1,000,000, the error is negative $80,000. The forecast was too high, or over-forecast.
Use a consistent sign convention throughout dashboards and reviews. Some organizations define error as forecast minus actual. Either approach works, but changing conventions makes directional patterns difficult to interpret.
📏 Use Absolute Error to Measure the Size of Misses
Errors can cancel each other out. If one month is $100,000 too high and the next is $100,000 too low, the total signed error is zero—even though neither forecast was accurate.
Absolute error removes the sign:
Absolute Error = |Actual - Forecast|Average absolute error is often a practical management measure because it states, in currency or units, how far forecasts tend to be from actual results. It does not, however, reveal whether the organization is consistently optimistic or conservative.
📊 Convert Error Into a Comparable Percentage
Percentage measures help compare accounts of different sizes. A $20,000 error has a very different meaning for a $30,000 marketing line than for a $10 million revenue line.
A common calculation is absolute percentage error:
Absolute Percentage Error = |Actual - Forecast| / |Actual|For example, forecasting $110,000 of actual revenue of $100,000 produces a 10% absolute percentage error. This is intuitive, but it becomes unstable when actual values are zero or very small.
⚠️ Handle Zero and Near-Zero Actuals Carefully
Percentage error can become misleading when the actual denominator is close to zero. Forecasting $5,000 when actual spend is $100 creates a very large percentage, even though the dollar impact may be modest.
For low-volume accounts, supplement percentage measures with dollar error, unit error, or a threshold rule. For instance, report percentage accuracy only for accounts above a defined activity level and use absolute dollars for the rest.
This is especially relevant for new products, one-time projects, seasonal lines, and discretionary spending categories.
⚖️ Track Bias, Not Just Accuracy
Forecast bias is the tendency to systematically over-forecast or under-forecast. A forecast can have acceptable average absolute error while still being biased in one direction.
Calculate mean error across periods using signed values. Under the convention of actual minus forecast, a negative average indicates persistent over-forecasting; a positive average indicates persistent under-forecasting.
Bias matters because it shapes decisions. Consistently optimistic revenue forecasts may lead to premature hiring or overspending. Consistently conservative cash forecasts may cause unnecessary borrowing or delayed investment.
🔍 Separate Random Error From a Repeating Pattern
No forecast will match reality every time. Some variation is random: a customer delays a purchase unexpectedly, a supplier shipment arrives late, or a bill is received earlier than usual.
A repeating error deserves more attention. If monthly bookings are over-forecast in eight of the last ten months, that is unlikely to be explained solely by normal noise. It suggests an assumption, process, or incentive problem.
Plot errors over time rather than relying only on averages. A simple trend chart often makes systematic optimism, seasonality, or a sudden model break visible.
🧱 Build a Forecast Bridge Before Investigating
A forecast bridge, sometimes called a variance bridge, decomposes the difference between forecast and actual into meaningful drivers. It moves the discussion from “we missed by $300,000” to “$180,000 came from volume, $90,000 from price, and $30,000 from timing.”
The right drivers depend on the line item. Revenue may require volume, price, mix, churn, and timing. Payroll may require headcount, start dates, compensation rates, bonuses, and payroll taxes.
Use drivers that management can understand and influence. A bridge with too many unexplained adjustment lines creates the appearance of detail without accountability.
🛒 Decompose Revenue Into Volume, Price, and Mix
For many businesses, revenue can be approximated as units sold multiplied by average realized price. Actual performance also depends on the mix of products, regions, channels, or customer segments.
A volume miss occurs when units, customers, transactions, or usage differ from plan. A price miss occurs when discounts, contract rates, promotions, or realization differ. A mix miss occurs when the company sells a different combination of products than expected.
Consider a hypothetical retailer that meets its unit target but misses revenue. The cause may be a higher share of lower-priced products, not poor demand. Treating that as a pure sales-volume issue would lead to the wrong corrective action.
🧾 Separate Bookings, Revenue Recognition, and Cash Collection
These three measures are related but not interchangeable. Bookings reflect contracted demand, revenue follows the accounting recognition pattern, and cash depends on invoicing and customer payment behavior.
A forecast can be correct about bookings yet wrong about revenue if implementation is delayed. It can be correct about revenue yet wrong about cash if collections slow. Each stage needs its own assumptions and accuracy checks.
| Measure | Typical driver | Common failure point |
|---|---|---|
| Bookings | Pipeline conversion and deal size | Optimistic close probability |
| Revenue | Delivery and recognition schedule | Delayed implementation or acceptance |
| Cash | Invoice timing and collections | Longer payment cycles or disputes |
🧲 Test Pipeline Conversion Assumptions
Sales forecasts often apply probability-weighted values to open opportunities. The crucial assumption is not merely the pipeline total; it is the likelihood that opportunities at each stage will close within the forecast period.
Compare historical conversion by stage, segment, deal size, and sales cycle length with the probabilities used in the forecast. A late-stage opportunity may have a strong eventual close rate but still be unlikely to close before quarter-end.
Watch for stage inflation, where opportunities are moved forward without objective evidence. This can make a forecast look supported by pipeline while quietly weakening its underlying conversion assumption.
⏳ Measure Timing Error Separately From Value Error
A deal that closes in April instead of March can create a material monthly or quarterly miss even if the annual contract value is unchanged. Calling this “only timing” can be misleading when cash, commissions, covenants, or capacity plans depend on the date.
Track whether forecasted items occurred early, on time, late, or not at all. For project businesses, compare milestone dates and completion percentages rather than looking only at total contract revenue.
Timing analysis also prevents a common error: assuming a recovered miss proves the original forecast was sound. A late transaction may restore annual revenue while exposing a weak monthly forecast process.
🏷️ Check Price and Discount Assumptions
Average selling price is often forecast from a list price or prior-period average, but actual price realization can move because of discounts, rebates, renewals, foreign exchange, promotions, or customer-specific terms.
Compare the forecasted price waterfall with the actual one. If list price held but discounting increased, the issue is not pricing power alone; it may be approval discipline, competitive pressure, or an inaccurate forecast of customer mix.
For recurring businesses, analyze renewals separately from new sales. Renewal pricing frequently behaves differently from acquisition pricing.
📦 Examine Product and Customer Mix
Mix is a frequent hidden cause of forecast error. A business may deliver the expected total units while generating less revenue or margin because customers chose lower-value products, shorter contracts, smaller order sizes, or lower-margin channels.
Break results down where economics differ materially: product family, geography, customer tier, sales channel, or contract type. Do not create dozens of segments merely because data exists; use segments that change the decision.
Mix analysis is particularly important when the forecast assumes a stable average margin. A shift toward lower-margin sales can produce a gross-profit miss even when revenue is on plan.
🏭 Translate Revenue Errors Into Gross Margin Drivers
Gross margin depends on revenue and the direct costs required to produce it. A margin forecast can fail because price missed, volume missed, product mix changed, input costs moved, labor productivity declined, or inventory adjustments differed from assumptions.
For a manufacturer, compare actual material usage and purchase costs with standard assumptions. For a service company, compare billable utilization and delivery labor rates with the forecast. For a software business, inspect hosting, support, and third-party costs that scale with usage.
Revenue success does not automatically imply margin success. Finance should make that distinction visible before management celebrates a top-line result.
👥 Audit Headcount and Hiring-Date Assumptions
Compensation is often one of the largest operating expenses, and forecast errors commonly arise from start-date timing rather than annual salary rates. A role expected to begin in January but filled in April changes both payroll and the capacity assumptions behind revenue plans.
Reconcile the forecast with an approved-position roster. For each role, track planned start date, actual start date, base pay, variable compensation, benefits, payroll taxes, and location if costs differ by region.
Also distinguish vacancies from savings. An unfilled role may reduce expense, but it can also reduce sales coverage, implementation capacity, or control effectiveness.
🧾 Classify Expenses by Their Real Cost Behavior
Expense forecasts fail when costs are treated as fixed even though they move with activity, or treated as variable even though contracts lock them in. A useful model separates fixed, variable, step-fixed, and discretionary costs.
- Fixed costs remain broadly stable over a relevant range, such as base rent.
- Variable costs move with units, revenue, or usage, such as payment processing fees.
- Step-fixed costs jump when capacity thresholds are crossed, such as adding a support team.
- Discretionary costs depend on choices, such as travel, events, or consulting.
When actual spending differs, first ask whether activity changed. Then ask whether the assumed relationship between activity and cost was correct.
💵 Forecast Working Capital as Operating Drivers
A cash forecast should not simply apply a flat percentage to revenue. Cash conversion depends on receivables, payables, inventory, deferred revenue, taxes, capital expenditures, and financing flows.
Translate assumptions into operational drivers. Accounts receivable may depend on invoice timing, payment terms, disputes, and customer concentration. Inventory may depend on demand, lead times, service levels, and purchase commitments.
This approach makes failures more diagnosable. If cash misses because receivables rose, the next question is whether sales changed, invoices went out late, customers paid late, or disputes increased.
🏦 Monitor Collections and Payment-Term Assumptions
Days sales outstanding, or DSO, is commonly used to summarize collection speed. It can be helpful, but an aggregate ratio may hide a few large overdue balances or changes in invoicing timing.
Review the accounts receivable aging report alongside the cash forecast. Segment major customers, payment terms, invoice status, and disputed balances. A small number of customers can materially affect a company with concentrated revenue.
Do not assume historical payment behavior will continue unchanged. New billing systems, contract changes, customer financial stress, or a dispute can alter the collection pattern quickly.
🌦️ Distinguish Assumption Failure From External Change
Not every miss means the team made a poor assumption. A supplier disruption, an abrupt regulatory development, a customer insolvency, or a severe weather event may create conditions that were not reasonably foreseeable when the forecast was prepared.
The review should classify the cause carefully. Was the event outside the modeled range? Was there an available leading indicator that the model ignored? Did the organization know about the exposure but fail to update the forecast?
This distinction preserves accountability without punishing teams for uncertainty itself. Good forecasting is not the elimination of surprise; it is the disciplined treatment of plausible risks.
🧪 Use Scenarios Instead of One Fragile Number
A single-point forecast implies more certainty than most businesses possess. Scenario planning gives management a range of coherent outcomes, such as base, upside, and downside cases.
Scenarios should change a connected set of drivers rather than applying arbitrary percentage changes everywhere. A downside sales scenario might include lower conversion, longer sales cycles, more discounting, and slower collections—not just lower revenue.
After actuals arrive, compare them with the scenarios. If actual results repeatedly land outside the range, the range may be too narrow or the model may be missing an important driver.
📈 Use Sensitivity Analysis to Find High-Leverage Assumptions
Sensitivity analysis changes one assumption while holding others constant to estimate its effect on an outcome. It helps prioritize the assumptions that deserve close monitoring.
For example, a finance team might test how a one-week shift in average collections affects minimum cash, or how a modest change in conversion affects quarterly revenue. The purpose is not to predict exactly; it is to identify leverage.
Focus review attention where uncertainty and financial impact are both high. An assumption that is uncertain but financially small may need monitoring, while an assumption that can materially change liquidity deserves stronger controls.
🚦Create Leading Indicators for Critical Assumptions
Actual financial results are lagging indicators. By the time revenue is reported, it may be too late to change the quarter. Leading indicators provide earlier evidence about whether assumptions remain credible.
Useful indicators vary by model:
- Pipeline coverage, stage movement, and sales-cycle aging for bookings.
- Backlog, delivery milestones, and utilization for recognized revenue.
- Open requisitions and accepted offers for headcount expense.
- Invoice submission status and aging trends for cash collections.
- Commodity prices, usage volumes, or supplier quotes for direct costs.
Connect each critical assumption to an observable signal and define who reviews it.
🗂️ Maintain an Assumption Register
An assumption register is a simple record of the inputs that materially drive a forecast. It should state the assumption, owner, source, date last validated, expected range, and relevant leading indicator.
This creates traceability. Instead of debating whether “finance got the forecast wrong,” the team can inspect the exact conversion rate, hiring date, payment term, or commodity cost assumption used at the time.
Keep the register practical. If it becomes a catalog of every cell in a spreadsheet, no one will maintain it. Include the drivers that meaningfully affect decisions.
🔄 Design a Useful Forecast Review Cadence
Forecast review works best as a regular operating rhythm, not a post-mortem performed only after a major miss. The cadence should match business speed: weekly for near-term cash or volatile sales, monthly for most operating forecasts, and quarterly for longer-range planning.
A productive review usually covers actual versus prior forecast, root-cause drivers, changes in assumptions, emerging risks, and actions. Keep the meeting focused on decisions rather than on explaining every immaterial variance.
Separate data correction from forecast learning. If an accounting posting was wrong, correct it. Then avoid treating the corrected number as evidence that the business assumption was wrong.
🧠 Ask “What Did We Know, and When?”
Hindsight can make every miss look predictable. A fair forecast review evaluates information available when the forecast was made, then examines when new information became available and whether the forecast was updated appropriately.
This question prevents two damaging habits: excusing all misses as unforeseeable and blaming teams for not knowing the future. It also reveals process delays, such as a sales update that took weeks to reach finance.
Document the timeline for material variances. Often the operational fact was known before the financial forecast changed.
🧩 Assign Owners to Drivers, Not Just Totals
Finance owns the integrity of the forecasting process, but it rarely owns all the business inputs. Sales leaders are typically closest to pipeline quality; operations understands capacity; procurement sees supplier costs; HR knows hiring plans; collections teams see payment risk.
Assign an accountable owner to each major driver and make the owner responsible for explaining changes in evidence, not for defending a desired outcome. This reduces the temptation to negotiate totals before understanding the mechanics.
Cross-functional ownership is especially valuable where one assumption affects several statements, such as hiring plans affecting payroll, capacity, revenue, and cash.
🛑 Avoid Incentives That Reward Optimism
Forecast quality deteriorates when people believe that a realistic downside forecast will be treated as poor performance. A forecast is an estimate, not a target, and confusing the two can encourage sandbagging or optimism.
Keep performance goals and forecasts distinct where possible. Goals express what the organization wants to achieve; forecasts express what it currently expects to occur given available evidence.
Leaders set the tone by responding constructively to early bad news. A smaller early adjustment is usually more useful than a confident number that collapses near period-end.
🧰 Build a Simple Accuracy Dashboard
A good dashboard need not be complex. It should show accuracy by horizon, absolute error, bias, material variances, and the driver breakdown for the most important lines.
Use visual flags sparingly. A red indicator should mean something actionable: an error beyond a defined threshold, a persistent directional bias, or a critical assumption without recent validation.
Pair summary metrics with drill-down capability. Executives need a concise view, while finance and operating owners need enough detail to locate the failing assumption.
🧱 Know When Granularity Makes Forecasts Worse
More detail is not always better. Forecasting every account, product, customer, and week can create a model that is difficult to maintain and falsely precise.
Use more granular forecasts where the drivers differ, the financial impact is material, and the data is reasonably reliable. Aggregate where behavior is stable or individual items are too small to forecast meaningfully.
The objective is an appropriate model, not the largest spreadsheet. Granularity should improve decisions, not simply increase the number of editable inputs.
🔧 Improve the Model Only After Diagnosing the Process
When errors occur, teams often respond by adding formulas, tabs, and adjustment factors. That can help, but the root cause may be a weak operating process: late CRM updates, unclear approval rules, missing contract data, or inconsistent definitions.
Classify the failure before choosing the fix:
- Data failure: the source data was incomplete, late, or incorrect.
- Assumption failure: the input was reasonable at first but proved wrong.
- Model failure: the logic did not represent the business relationship well.
- Process failure: relevant new information did not reach the forecast in time.
Different causes require different remedies. Better formulas cannot repair an incentive problem, and a new dashboard cannot fix unreliable source data.
✅ The Core Principle: Learn at the Driver Level
The strongest forecasting organizations do not judge quality only by whether one total was right. They learn which assumptions were right, which failed, how early the evidence appeared, and how the model should change next time.
Start with preserved forecast versions, calculate error and bias, decompose material variances into drivers, and connect each important assumption to an owner and leading indicator. Then review the result without hindsight bias.
This turns forecast accuracy into a management discipline. The goal is not a perfect prediction; it is a more reliable understanding of uncertainty and a faster response when reality changes.
A forecast becomes useful when every material miss leads to a clearer view of the business driver behind it—and a better decision before the next reporting period. 📊💡💰