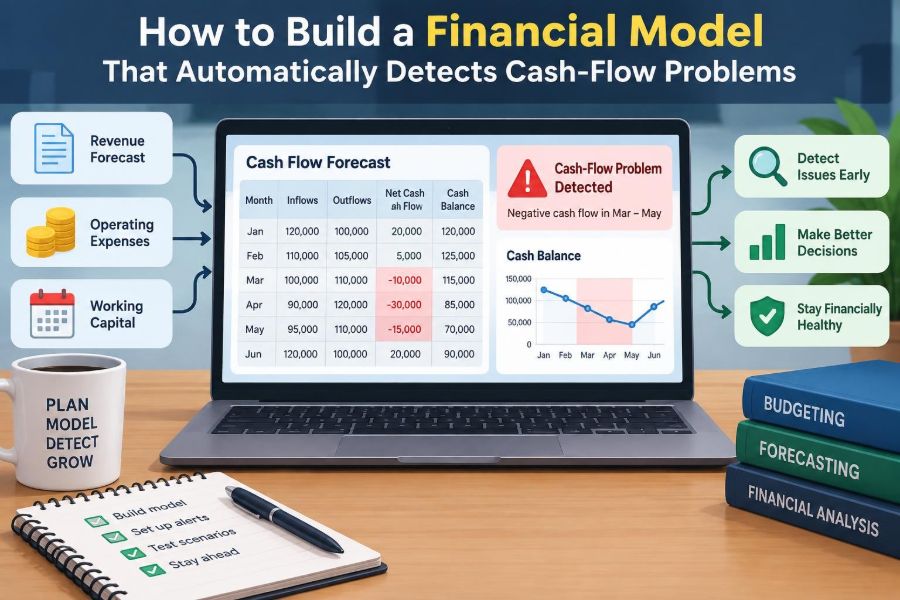

A business can look profitable on paper and still be unable to pay payroll on Friday. A growing consultancy may have a full sales pipeline, a retailer may be selling more each month, and a contractor may have signed valuable work—yet the bank balance can still move in the wrong direction.
The problem is usually timing. Revenue recorded this month may not be collected for 30, 60, or 90 days. Inventory, wages, taxes, loan payments, and supplier deposits may need cash much sooner. Profit answers whether the business is creating value over time; cash flow answers whether it can meet its obligations now.
A useful financial model does more than forecast a closing cash balance. It tests assumptions, identifies the weeks or months where cash becomes tight, and makes the reason visible early enough to act. That turns the model from a reporting exercise into a decision tool.
This article explains how to build that kind of model: one that links operational drivers to cash movements and raises clear warnings before a shortfall becomes a crisis.
🧭 Start With the Question the Model Must Answer
Define the decision before building worksheets. For many organizations, the central question is: Will available cash fall below the minimum required balance in any forecast period?
Other decisions may matter too: when to draw on a credit facility, whether a hiring plan is affordable, how much customer payment delay the business can tolerate, or whether a proposed capital purchase should be postponed.
A model without a stated decision often becomes a collection of assumptions. A model with a clear question has an understandable design and a useful output.
💵 Separate Profit From Cash
Accrual accounting recognizes income when earned and expenses when incurred. Cash forecasting records when money actually enters or leaves a bank account. Both views are necessary, but they are not interchangeable.
For example, a company may invoice $100,000 in June, recognize the revenue in June, and receive payment in August. June profit may improve while June cash does not. If payroll and suppliers are due in July, the timing gap matters more than the reported revenue.
Your model should therefore include an income statement forecast and a separate cash-flow schedule connected by working-capital assumptions.
🗓️ Choose a Forecast Horizon That Matches the Risk
Use a horizon long enough to reveal the full cash cycle. A seasonal wholesaler may need 12 to 18 months so that inventory buying, peak sales, and collections are all visible. A stable service business may need a rolling 13-week view for near-term payment control plus a monthly forecast for the longer term.
Short periods reveal immediate pressure; longer periods reveal structural problems. Many practical models use both: weekly columns for the next three months and monthly columns thereafter.
⏱️ Match the Time Granularity to Payment Timing
Monthly forecasting can hide a crisis that occurs in the second week of a month. If payroll is paid weekly and a large tax payment is due on the 15th, a month-end balance may look healthy even though the account temporarily goes negative.
Use weekly forecasting where receipts and payments are uneven, cash reserves are thin, or management needs to schedule payments carefully. Monthly forecasting is usually sufficient when cash flows are predictable and the liquidity buffer is substantial.
🏦 Define What Counts as Available Cash
Start with actual bank balances, but do not stop there. A cash model should distinguish unrestricted cash from amounts that cannot freely fund operations, such as customer deposits held in trust, restricted project funds, or balances pledged under financing arrangements.
Then define the liquidity sources that are genuinely available. An undrawn revolving credit facility may be included only to the extent that its terms, borrowing base, and covenants permit use.
Use a clear formula: available liquidity = unrestricted cash + eligible undrawn committed facilities. Keep ineligible cash out of the safety calculation.
🧱 Build a Simple Model Architecture
A robust model is usually easier to audit than an elaborate one. Separate inputs, calculations, outputs, and checks so a user can see where each number comes from.
- Inputs: sales assumptions, payment terms, payroll dates, debt terms, tax dates, and opening balances.
- Operating schedules: revenue, collections, inventory, payables, payroll, and operating expenses.
- Financing schedules: debt, interest, equity injections, and facility availability.
- Outputs: cash forecast, alerts, dashboards, and scenarios.
- Controls: reconciliations and error checks.
This layout reduces the temptation to type numbers directly into output rows.
🔗 Use One Source of Truth for Assumptions
Place key assumptions in a dedicated input area and link every calculation to it. If the average collection period changes from 45 to 60 days, one controlled input should update the collections schedule and every resulting cash balance.
Label assumptions with units and timing. “60” is ambiguous; “customer payment delay: 60 days” is not. Also separate historical facts from forecast assumptions with distinct formatting or clearly named sections.
Hard-coded numbers buried inside formulas are one of the fastest ways to make a forecast unreliable.
📈 Forecast Revenue From Operating Drivers
Revenue should be forecast from the drivers that actually create it. A subscription business may use customers, churn, and average monthly fee. A manufacturer may use units sold and selling price. A consulting firm may use billable staff, utilization, and billing rates.
Driver-based forecasting is not automatically more accurate, but it makes assumptions testable. If forecast sales rise, the model can show whether that growth requires additional staff, inventory, marketing, or payment capacity.
For a short-term cash forecast, confirmed orders and existing contracts are generally stronger evidence than broad annual growth targets.
🧾 Convert Sales Into Customer Collections
Revenue becomes cash through invoicing and collection behavior. Build a collections schedule that assigns each sale to the period in which it is expected to be billed and paid.
For a simple model, apply a collection pattern. For example, a hypothetical business might collect 20% in the month of sale, 60% the next month, and 20% two months later. A more detailed model can track invoice cohorts by customer or contract.
Use the behavior you observe, not merely the terms printed on invoices. Contractual “net 30” terms do not guarantee payment in 30 days.
🧮 Model Accounts Receivable Explicitly
Accounts receivable is the bridge between recognized revenue and cash collected. In a monthly model, the relationship can be expressed as:
Closing receivables = Opening receivables + Credit sales - Cash collectionsThis calculation serves two purposes. It produces a balance-sheet forecast and provides a control: if collections are modeled correctly, receivables should move consistently with sales and payment timing.
Watch for concentration. A model based on average payment days can be misleading when one large customer accounts for much of the receivable balance.
📦 Forecast Inventory and Purchase Commitments
For product businesses, inventory often consumes cash before sales generate collections. Forecast purchases from expected sales, target inventory levels, lead times, and gross-margin assumptions—not simply as a flat percentage of revenue.
Consider committed purchase orders separately from planned purchases. A commitment may be difficult or expensive to cancel even if sales weaken. Long lead times can also force inventory decisions months before customer demand is certain.
Service businesses may have little inventory, but they may still have prepaid software, subcontractor deposits, or project mobilization costs that create the same timing issue.
🤝 Turn Purchases Into Supplier Payments
Purchases are not always paid immediately. Model the payment pattern using supplier terms and actual practice, just as you did for collections.
A common accounting relationship is:
Closing payables = Opening payables + Credit purchases - Cash paid to suppliersStretching supplier payments can temporarily preserve cash, but it may damage relationships, trigger supply interruptions, or eliminate early-payment discounts. Treat it as a managed decision, not an invisible assumption.
👥 Schedule Payroll by Actual Pay Dates
Payroll is usually one of the least flexible cash outflows. Include gross wages, employer payroll costs, bonuses, commissions, benefits, and the timing of payroll tax remittances.
Do not assume payroll cash equals the monthly wage expense. Biweekly pay cycles create uneven cash weeks, while bonus payments and annual benefit renewals can create sharp spikes.
Where workforce plans drive revenue, link headcount and hiring dates to payroll automatically. This exposes the cash cost of adding capacity before new customers begin paying.
🧾 Capture Taxes, Interest, and Other Non-Operating Payments
Cash problems often arise from expenses that are absent from an operating manager’s view. Include sales taxes collected and remitted, income-tax installments where applicable, insurance renewals, lease deposits, interest, principal repayments, legal settlements, and shareholder distributions.
Tax rules and payment schedules vary by jurisdiction and entity. The model should use dates and amounts reviewed by qualified finance, tax, or legal advisers rather than generic assumptions.
These flows are often predictable, which makes omitting them especially avoidable.
🏗️ Treat Capital Expenditure as a Separate Decision
Buying equipment, renovating a location, or implementing a major system may not immediately reduce operating profit, but it can sharply reduce cash. List each material capital expenditure with approval status, expected payment date, deposits, and financing source.
A lump-sum estimate is less useful than a staged schedule. A project may require a deposit now, progress payments during implementation, and final payment after delivery.
Separating capital expenditure from routine operating costs helps management see which cash pressure is structural and which is discretionary.
🏦 Build a Debt and Financing Schedule
Debt is not just an opening balance and an interest expense. Model each facility’s opening principal, scheduled repayment, optional repayment, drawdowns, interest calculation basis, fees, maturity date, and availability conditions.
Interest often depends on the balance and rate applicable during the period. Revolving facilities may also have unused-line fees or collateral-based limits. Read the agreement rather than assuming the headline limit is fully usable.
If the model forecasts borrowing, show it as a response to a cash need—not as an unexplained plug that hides the problem.
🧷 Include Covenants and Borrowing-Base Limits
A company can have an undrawn facility and still be unable to access it. Loan agreements may require financial ratios, minimum liquidity, reporting compliance, or a borrowing base tied to eligible receivables and inventory.
Create a covenant schedule that calculates the relevant measures using the definitions in the agreement. If exact definitions are complex, flag the model as an estimate and reconcile it to lender reporting.
The most useful warning is not “cash is low.” It is “cash is low and expected facility capacity may be restricted.”
🔄 Link the Three Financial Statements
An integrated model connects the income statement, balance sheet, and cash-flow forecast. Net income affects retained earnings; receivables, inventory, and payables affect working capital; debt affects interest and liabilities; capital expenditure affects fixed assets and cash.
Full integration reduces contradictions. For example, if revenue rises but receivables do not change despite slow collection assumptions, the model has a logic problem.
You do not need a highly complex valuation model to gain this benefit. Even a concise operating model should reconcile its major balance-sheet movements to cash.
🧪 Calculate the Cash Waterfall
Present the forecast as a cash waterfall that users can read from top to bottom:
- Opening available cash
- Customer receipts and other inflows
- Operating payments
- Taxes, interest, and debt service
- Capital expenditure and other investing flows
- Financing inflows or outflows
- Closing available cash
This sequence makes the cause of movement visible. A single “net cash flow” line is less informative because it conceals the drivers that management can change.
🚨 Set a Minimum Cash Threshold
A warning requires a benchmark. Set a minimum cash threshold based on the organization’s volatility, payment commitments, access to financing, and management’s risk tolerance.
The threshold is not necessarily zero. A zero balance leaves no room for an unexpected collection delay, bank-processing issue, disputed invoice, or emergency repair. Some organizations also define a higher management buffer that triggers action before the formal minimum is breached.
Document who approved the threshold and review it when the business changes.
🟡 Create Graduated Warning Signals
A good alert system distinguishes between attention and emergency. Use conditional formatting, status labels, or dashboard indicators tied to specific rules.
| Status | Example trigger | Suggested response |
|---|---|---|
| Green | Cash remains above the management buffer | Monitor normal forecast updates |
| Amber | Cash falls below buffer but remains above minimum | Review collections, discretionary spending, and timing |
| Red | Cash falls below minimum or facility availability | Escalate funding and payment actions immediately |
Use formulas rather than manually colored cells. A warning that depends on someone remembering to change a color is not an automated control.
🔔 Detect the First Breach, Not Just the Lowest Balance
The lowest forecast balance is useful, but the first breach date is often more actionable. It tells management how long remains to accelerate collections, negotiate terms, delay spending, arrange financing, or revise plans.
Add outputs for the first period below the buffer, first period below minimum cash, maximum projected funding need, and the period in which recovery occurs. These indicators turn a long row of numbers into a practical timetable.
🔍 Explain the Driver Behind Every Alert
An alert should point to a cause. Build bridge analyses that compare the current forecast with the prior version or budget and attribute the cash movement to major drivers.
- Lower sales or later billing
- Slower customer collections
- Earlier inventory purchases or supplier payments
- Higher payroll or faster hiring
- Tax, debt, or capital expenditure timing
- Reduced financing availability
For example, a red warning caused mainly by one delayed customer needs a different response from a warning caused by permanently unprofitable pricing.
🌦️ Use Scenarios Rather Than a Single Forecast
A base case is only one plausible path. Add downside and upside cases that change a small number of relevant drivers, such as sales volume, collection delays, gross margin, hiring dates, or supplier terms.
A downside case should be credible, not theatrical. The aim is to understand exposure and prepare actions, not to manufacture the worst imaginable outcome.
Scenario outputs should show whether the cash warning changes in timing, depth, or duration. That helps leaders distinguish a manageable fluctuation from a financing requirement.
🎯 Test Sensitivities That Matter Most
Sensitivity analysis changes one assumption at a time to show which variable has the largest effect on liquidity. This is especially useful when management debates where to focus effort.
For a receivable-heavy business, test additional days to collect. For a retailer, test inventory turns and gross margin. For a project business, test milestone billing and cost overruns. A sensitivity that does not reflect how the business actually earns and spends cash adds little value.
Rank results by impact on the minimum cash balance or peak facility draw, not by the drama of the percentage change.
🧯 Connect Alerts to Pre-Agreed Actions
Detection alone does not solve a cash-flow problem. For each alert level, assign an owner, a decision deadline, and an action menu.
Possible actions include contacting overdue customers, issuing invoices sooner, pausing nonessential hiring, rescheduling discretionary capital expenditure, negotiating supplier timing, drawing an approved facility, or seeking new funding. Each action has trade-offs, so it should be considered before the breach date.
A useful model makes those trade-offs visible. Delaying a supplier payment may improve this week’s cash while creating procurement risk next month.
✅ Add Reconciliations and Error Checks
Automated warnings are only as reliable as the underlying model. Add visible checks that return zero or “OK” when logic is consistent.
- Opening cash in each period equals the prior period’s closing cash.
- Cash-flow closing cash agrees to the balance-sheet cash balance.
- Receivable, payable, inventory, debt, and fixed-asset schedules reconcile to the balance sheet.
- Sources and uses of financing balance.
- No formula errors, unintended circular references, or missing periods exist.
Do not hide failed checks on a distant worksheet. Put a concise control panel near the main output.
🧹 Avoid Circular References Where Possible
Circular references occur when two calculations depend on each other, such as cash determining debt drawdowns while debt drawdowns determine interest and therefore cash. Spreadsheet software can iterate through this loop, but the result may be hard to understand and sensitive to settings.
Where practical, use a simple sequence: calculate pre-financing cash, determine required drawdown, then calculate interest from an agreed approximation or prior-period balance. If iteration is necessary, document it clearly and test the results.
Complexity is justified only when it materially improves the decision.
📊 Design an Output Page for Decisions
Senior users rarely need every schedule first. Give them an output page with the opening cash, ending cash, available facility, minimum liquidity, first breach date, peak funding need, and major drivers.
Use a compact chart only when it improves interpretation—for example, a line showing available liquidity against the minimum threshold. Pair it with plain-language commentary: “Cash falls below the buffer in Week 8 because two large invoices are now expected a month later.”
Dashboards should summarize the model, not replace its audit trail.
🔄 Refresh the Forecast on a Disciplined Cadence
A cash model loses value when it remains unchanged after business conditions move. Update actual bank balances, receipts, invoices, payment dates, payroll changes, purchase commitments, and financing availability on a regular schedule.
Near-term forecasts generally deserve more frequent updates than long-range plans. When updating, retain the previous version so users can explain what changed and whether earlier assumptions were realistic.
The cadence should fit the business: weekly may be appropriate for tight liquidity; monthly may suit stable operations.
🧠 Learn From Forecast Variances
Compare forecast cash movements with actual results. Focus on material timing differences: which customers paid later, which costs arrived earlier, which estimates consistently missed, and which inputs were unavailable when needed.
Do not treat variance review as a search for blame. It is a way to improve collection curves, payment schedules, and accountability for inputs. Over time, the model should become more specific where the business repeatedly produces surprises.
Accuracy matters, but timely visibility often matters first. A forecast that is directionally useful today can support better decisions than a theoretically perfect forecast delivered too late.
⚠️ Recognize What the Model Cannot Predict
No model can guarantee liquidity. Customer insolvency, supply disruption, banking delays, legal claims, rate changes, and operational failures may occur outside the forecast assumptions.
The model is also vulnerable to false precision. A forecast showing cash to the nearest dollar can look authoritative even when its sales assumptions are uncertain. Use appropriate rounding, disclose significant assumptions, and present ranges or scenarios where uncertainty is high.
Professional judgment remains essential, particularly when financing terms, tax obligations, or contractual rights are involved.
🛠️ Build the First Version Before Perfecting It
Start with the material flows: opening cash, collections, supplier payments, payroll, taxes, debt service, capital expenditure, and financing. Make those schedules link correctly, add a minimum-cash warning, and reconcile the balances.
Then improve detail where it changes decisions. A model that tracks the five customers responsible for most collections may be more useful than one that estimates dozens of minor expense lines with artificial precision.
Version one should be transparent enough that another finance professional can trace each warning back to an assumption.
🏁 The Core Principle: Make Timing Visible Early
The strongest cash-flow model is not the one with the most tabs. It is the one that translates business activity into payment dates, compares projected liquidity with a deliberate safety threshold, and identifies the drivers of any breach.
Connect sales to collections, purchases to supplier payments, staffing to payroll dates, investment plans to cash outflows, and debt terms to actual facility availability. Then test credible changes before they become urgent.
When that structure is in place, cash alerts become prompts for informed action rather than late discoveries in a bank statement.
A financial model detects cash-flow problems when it treats cash as a timed sequence of commitments and receipts—not as a residual number at month-end. Build that sequence clearly, challenge its assumptions regularly, and use the warning time to make better choices. 💰📈🧭