
A department manager wants to hire two people, replace aging equipment, and launch a new service line. Each idea sounds reasonable on its own. Together, however, they compete for the same limited cash.
Meanwhile, the finance team is being asked a harder question than “Can we afford it?” They need to show what happens to profit, cash flow, debt capacity, and business value if sales arrive later than expected, costs rise, or customers pay more slowly.
This is where financial modeling becomes practical rather than abstract. A well-built model turns operating assumptions into a structured view of future financial consequences.
For students, financial modeling connects accounting statements to real decisions. For working professionals, it provides a common language for planning, testing alternatives, explaining trade-offs, and making decisions with appropriate caution.
🧭 Financial Modeling as a Decision Framework
A financial model is a structured representation of how a business or project is expected to perform financially. It uses assumptions about prices, volumes, costs, investments, financing, and timing to estimate future results.
A model is not a prediction machine. It is a decision framework: if these conditions occur, these financial outcomes are likely to follow. That distinction matters because the quality of a model depends as much on its assumptions as on its formulas.
🔗 Connecting Operations to Financial Statements
The most useful models begin with operational drivers rather than starting with an income statement. A retailer may model store traffic, conversion rate, average transaction value, inventory turns, and staffing hours. A manufacturer may model units produced, material usage, labor hours, and capacity.
Those drivers flow into revenue, expenses, working capital, cash flow, and eventually the balance sheet. This linkage helps managers see why an operational change affects finance, rather than treating financial results as unexplained totals.
🧱 The Core Building Blocks of a Model
Most business models contain a similar architecture, even when their level of detail differs:
- Inputs: assumptions, historical data, contracts, and management plans.
- Calculations: schedules for revenue, costs, capital expenditure, debt, taxes, and working capital.
- Outputs: financial statements, key performance indicators, valuation measures, and scenario results.
- Controls: checks that reveal errors, such as whether the balance sheet balances.
Keeping inputs, calculations, and outputs separate makes the model easier to audit and update.
📚 Why Accounting Knowledge Is Essential
Financial modeling is often associated with spreadsheets, but it rests on accounting logic. Revenue recognition, expense matching, depreciation, accrued liabilities, inventory accounting, and cash collection timing can materially change the output.
For example, a business can report sales before it receives cash. A model that treats every sale as immediate cash inflow may overstate liquidity, especially for a company that sells on credit. Accounting knowledge prevents a visually polished spreadsheet from becoming financially misleading.
🗓️ Using Models to Build a Budget
A budget is a financial plan for a defined period, often a fiscal year. Financial modeling makes the budget more than a list of target numbers by showing how departmental actions connect to company-wide results.
Sales assumptions can drive production requirements; production drives purchases and labor; purchases affect inventory and supplier payments; and all of those items affect cash needs. A model allows finance teams to test whether the proposed budget is internally consistent before it becomes a performance commitment.
🎯 Driver-Based Budgeting
Driver-based budgeting estimates financial results from the activities that cause them. Instead of simply increasing last year’s travel expense by a percentage, a business might budget travel based on planned client visits, average trip cost, and expected hiring.
This approach is especially effective where costs have identifiable causes. A call center can use expected call volume and average handling time. A subscription company can use customer additions, churn, and support tickets per customer.
It does require reliable definitions. If teams calculate drivers differently, the budget can appear precise while resting on inconsistent data.
🏢 Allocating Scarce Resources
Budgets are also resource-allocation tools. A model helps compare competing uses of cash: a marketing campaign, additional inventory, software implementation, equipment replacement, or debt repayment.
Comparison should not rely solely on projected profit. Some proposals create long-term capability, while others release cash or reduce operational risk. Decision-makers should consider timing, strategic fit, implementation capacity, and the risk of not acting alongside modeled financial returns.
📊 Modeling Revenue in a Useful Way
Revenue is often the most sensitive line in a model, so it deserves more thought than a single annual growth rate. Breaking it into price and volume usually produces a clearer analysis.
A simple revenue structure might be customers × purchase frequency × average selling price. A business with several products may model each category separately because margins, seasonality, and demand drivers may differ substantially.
Granularity should serve a decision. Modeling every minor product may add maintenance work without improving judgment.
⚙️ Translating Costs into Financial Effects
Cost models should distinguish between variable costs, which move with activity, and fixed costs, which remain relatively stable over a relevant range. Materials per unit are commonly variable; rent is commonly fixed for the duration of a lease.
The distinction supports break-even analysis and margin planning. Still, “fixed” does not mean permanent. A company may need a new supervisor, warehouse, or software license once volume exceeds a capacity threshold.
💵 Cash Flow Budgeting and Liquidity
Profit and cash are related but not identical. Cash flow modeling estimates when money is actually received and paid, which is critical for meeting payroll, supplier obligations, taxes, and loan payments.
Suppose a profitable contractor invoices customers at project milestones but pays subcontractors earlier. The income statement may look healthy while the company faces a temporary cash shortfall. A monthly or weekly cash forecast can reveal this gap early enough to arrange funding or renegotiate payment terms.
🔄 Working Capital as a Planning Variable
Working capital generally reflects short-term operating assets and liabilities, including receivables, inventory, payables, and accrued expenses. It is not merely an accounting balance; it represents cash tied up in daily operations.
Growing revenue can consume cash when receivables and inventory rise faster than supplier financing. Models commonly estimate these balances using collection days, inventory days, and payment days. These assumptions should reflect actual operating practices, not only optimistic targets.
🧾 Integrating the Three Financial Statements
An integrated model links the income statement, balance sheet, and cash flow statement. Net income affects retained earnings; depreciation reduces accounting profit but is added back in operating cash flow; capital expenditure creates fixed assets; debt changes interest expense and financing cash flows.
This integration catches contradictions. If a model shows rising sales but no increase in receivables, inventory, or cash collection, the assumptions may need review. A balance sheet that does not balance is not a minor formatting issue—it signals a broken financial relationship.
🔮 Forecasting Beyond the Annual Budget
A budget is commonly fixed for a year, while a forecast should evolve as new information becomes available. Forecasting uses actual performance, current conditions, and revised assumptions to estimate the remaining period.
A rolling forecast continuously extends the planning horizon. For example, a company may always forecast the next twelve or eighteen months. This can be more useful than waiting for the next annual budgeting cycle when demand, costs, or financing conditions are changing quickly.
📈 Choosing Forecast Methods
No single forecasting method suits every line item. Stable, repetitive costs may be projected from recent run rates. Seasonal sales need comparable periods. Contracted revenue may be forecast from signed agreements and delivery schedules.
| Situation | Useful modeling approach | Key caution |
|---|---|---|
| Established recurring sales | Trend and customer-retention analysis | Past patterns can break after a market change |
| New product launch | Unit economics and adoption scenarios | Early demand is highly uncertain |
| Project-based work | Backlog, milestones, and delivery schedules | Completion dates may shift |
| Commodity-sensitive business | Volume and price scenarios | External prices may move sharply |
The method should match the economics of the business, not the spreadsheet template already available.
🌦️ Scenario Planning
Scenario planning compares coherent versions of the future rather than changing one assumption in isolation. A base case may reflect the operating plan, an upside case may include stronger demand and improved utilization, and a downside case may combine slower sales with higher costs and delayed collections.
Each scenario should tell a plausible business story. Combining high growth, expanding margins, lower capital spending, and faster customer payment without explanation can create an attractive but inconsistent case.
🧪 Sensitivity Analysis
Sensitivity analysis asks how much a result changes when one key assumption moves. For a property investment, the output may be sensitive to occupancy, rental rates, operating costs, exit value, and borrowing costs.
This does not produce certainty. It identifies which assumptions deserve management attention. If a small change in customer churn sharply reduces cash flow, the business may need stronger retention plans, a more conservative financing structure, or both.
🚨 Stress Testing Downside Risk
Stress testing examines severe but plausible conditions. Its purpose is not to select the most pessimistic number; it is to identify failure points such as covenant breaches, cash deficits, inventory write-downs, or inability to fund essential operations.
A useful stress test considers management actions too. Could hiring be paused? Could nonessential capital spending be deferred? Are there committed credit facilities? A model is more valuable when it links risk identification to realistic response options.
🏷️ Valuation and the Value of Future Cash Flows
Valuation estimates what a business, project, or financial asset may be worth. One central principle is that value depends on the cash flows an owner expects to receive and the risk attached to receiving them.
Accounting profit matters, but valuation often focuses on cash flows because investors cannot spend depreciation or uncollected revenue. The exact definition of cash flow depends on the purpose of the analysis, the type of asset, and the capital structure being evaluated.
⏳ Discounted Cash Flow Analysis
Discounted cash flow, or DCF, converts estimated future cash flows into a present value. It reflects the time value of money: a dollar received sooner can generally be reinvested sooner and is less exposed to uncertainty than a dollar received later.
A simplified expression is present value = future cash flow ÷ (1 + discount rate)^period. The discount rate should reflect the required return and risk relevant to those cash flows. Selecting it mechanically can create false confidence.
♾️ Terminal Value and Long-Term Assumptions
Many DCF models include a terminal value, representing value beyond the explicit forecast period. It may be estimated using a sustainable growth assumption or a market-based exit multiple.
Because terminal value can form a substantial part of a valuation, small changes in long-term growth, margins, or discount rate can have a large effect. A responsible model clearly displays these assumptions and tests alternatives rather than hiding them in a formula.
⚖️ Comparable Companies and Market Multiples
Relative valuation compares a company with similar businesses using measures such as enterprise value relative to earnings, sales, or operating profit. It can be useful when there are genuinely comparable public companies or recent transactions.
However, a multiple is not a verdict. Two firms in the same industry can differ in growth prospects, customer concentration, debt, margins, geographic exposure, and accounting policies. Comparable analysis works best as a cross-check alongside a cash-flow-based perspective.
🏗️ Capital Budgeting for Major Projects
Capital budgeting applies financial modeling to long-lived investments such as machinery, a new location, a technology platform, or a renewable energy installation. The model traces upfront costs, operating benefits, maintenance requirements, taxes, and residual value over the project’s life.
Common outputs include net present value, internal rate of return, payback period, and break-even volume. Each has a role, but none replaces strategic judgment. A project with a slower financial return may still be necessary for safety, compliance, resilience, or competitive capability.
📉 Net Present Value and Internal Rate of Return
Net present value (NPV) measures the difference between the present value of expected cash inflows and the initial investment. A positive NPV at the chosen required return indicates that the project is expected to create value under the model’s assumptions.
Internal rate of return (IRR) is the discount rate that makes NPV equal zero. It is intuitive as a percentage return, but it can be misleading when cash flows change direction more than once or when projects differ greatly in scale and timing. Reviewing NPV, not IRR alone, is generally safer.
🧮 Evaluating Investment Decisions
Investment decisions need a model that reflects the investor’s question. A shareholder may focus on returns and valuation. A lender may emphasize debt service capacity, collateral, and downside protection. A manager may focus on operating cash flow and strategic benefits.
Consider a hypothetical café deciding whether to open a second location. The model should include build-out costs, lease commitments, staffing ramp-up, sales cannibalization from the first site, inventory, taxes, and the time needed to reach stable sales. Omitting ramp-up losses could make the opportunity appear safer than it is.
🏦 Debt Modeling and Financing Capacity
Debt schedules show opening balances, borrowings, repayments, interest, and closing balances over time. They are essential when a business finances expansion or must maintain lender requirements.
Interest expense may depend on average debt, periodic balances, or variable rates. Models should specify the convention used. They should also test whether operating cash flow can meet principal and interest payments under less favorable scenarios, rather than assuming refinancing will always be available.
🧷 Assumptions, Evidence, and Model Governance
Every model contains assumptions, so good practice makes them visible. Sources may include signed contracts, historical trends, supplier quotations, market observations, management plans, or informed estimates. Labeling an assumption by source and date makes later review far easier.
Model governance includes version control, reviewer access, documentation, and clear ownership. In a team setting, an assumption should not change silently. A small undocumented edit to a price, start date, or formula can materially alter a decision output.
✅ Building Error Checks into the Workbook
Spreadsheet errors are common because models often contain many linked cells. Strong models include simple controls that turn errors into visible warnings.
- Confirm that assets equal liabilities plus equity.
- Check that beginning cash plus cash movements equals ending cash.
- Flag negative inventory or impossible headcount values.
- Compare forecast margins and growth rates with historical ranges.
- Use consistent signs, units, dates, and currency conventions.
Checks do not prove a model is correct, but they make basic failures easier to detect before results are presented.
🗣️ Communicating Model Outputs Clearly
A decision-maker rarely needs every worksheet. They need the conclusion, the assumptions that drive it, the range of outcomes, and the actions required. A concise summary can present the base case, key sensitivities, funding needs, and major risks.
Charts and dashboards can help, but only if they preserve context. Showing an expected return without showing the investment amount, timing, uncertainty, or downside case can create a misleading impression of precision.
🧯 Common Modeling Mistakes
A frequent mistake is confusing a forecast with a target. A target expresses an aspiration; a forecast estimates what is likely given current information. Mixing them encourages optimistic assumptions and weak accountability.
Other recurring problems include hard-coding numbers inside formulas, double-counting growth, ignoring working capital, using annual figures when monthly cash timing matters, and treating a valuation output as a fact. The remedy is disciplined structure, review, and transparent assumptions—not more complicated formulas.
🛠️ A Practical Modeling Workflow
A reliable workflow reduces rework and makes review more efficient:
- Define the decision and the audience.
- Identify operational drivers and required outputs.
- Gather historical data and document assumptions.
- Build schedules before summary statements.
- Link the three financial statements where relevant.
- Add scenarios, sensitivities, and error checks.
- Review outputs for business realism, not only formula accuracy.
- Update the model as actual results provide new evidence.
Starting with the decision prevents a model from becoming a large spreadsheet with no clear purpose.
🌱 Matching Model Complexity to the Decision
A start-up evaluating a short runway may need a detailed monthly cash model but not a highly granular multinational tax schedule. A listed company considering an acquisition may require deeper valuation, financing, and integration analysis.
The right level of complexity is the minimum needed to make a sound decision and understand material risks. Excess detail can obscure the key drivers, while oversimplification can exclude the very relationships that determine whether the plan works.
🤝 Financial Models Support Judgment, Not Replace It
Models make assumptions explicit and consequences visible, but they cannot fully capture customer behavior, management quality, regulation, competitive response, or unexpected disruption. Numbers should inform judgment rather than substitute for it.
When model results conflict with operational experience, the answer is not automatically to override the model or trust it blindly. Investigate the difference. It may reveal an unrealistic assumption, a missing cost, or an opportunity the historical data does not yet show.
🧠 The Core Principle for Better Decisions
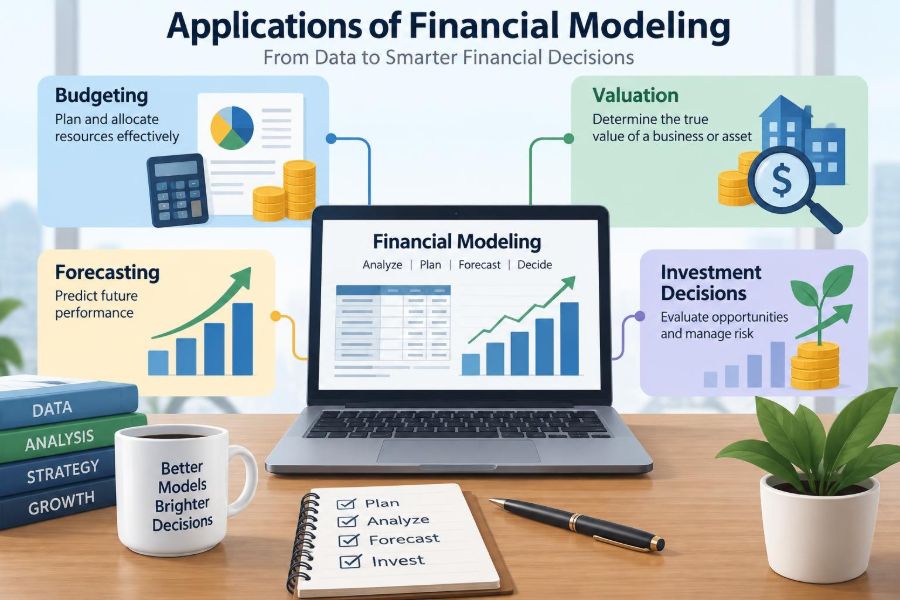
The applications of financial modeling in budgeting, valuation, forecasting, and investment decisions are connected by one discipline: translate business reality into linked financial consequences, then test what could change.
A useful model is transparent about uncertainty, grounded in accounting relationships, and designed for a specific decision. Its value lies less in producing one impressive number than in helping people understand the drivers, trade-offs, and risks behind that number.
Financial modeling is most powerful when it turns assumptions into informed conversations and informed conversations into better choices. Used with sound judgment and regular review, it helps organizations plan with more clarity even when the future cannot be known with certainty. 💰📊🧭