
A team may spend days building a forecast, agreeing on every formula, and tying the final cash balance to the balance sheet. Then a large customer delays an order, a supplier raises prices, or hiring takes longer than planned. The model still calculates correctly—but its single answer no longer describes the business.
That is the weakness of treating a forecast as a prediction. Financial forecasts are useful because they turn assumptions into a view of the future, not because they can remove uncertainty from it.
Scenarios and sensitivity analysis give uncertainty a disciplined place in the model. Instead of defending one precise number, finance teams can show what changes, why it changes, and which decisions deserve attention first.
For students, this is a practical modeling skill. For working professionals, it is a way to turn a spreadsheet from a reporting artifact into a decision tool.
🧭 A Forecast Is a Structured View, Not a Promise
A financial forecast estimates future revenue, costs, profit, cash flow, and financial position from current information and explicit assumptions. It may be a twelve-month operating plan, a rolling forecast, or a long-range model for an investment decision.
Its reliability should not be judged by whether one headline number happens to match actual results. A more useful test is whether the model makes assumptions visible, responds logically when conditions change, and helps people act before a problem becomes urgent.
Reliable forecasting means being transparent about uncertainty, not pretending uncertainty does not exist.
🎯 Why One “Best” Number Can Mislead
A single base-case forecast often becomes the number management remembers. This can encourage false precision: revenue might be shown to the nearest dollar even though customer timing, conversion rates, and pricing are uncertain.
The danger is not using a base case. Organizations need a central planning view. The danger is allowing that view to stand alone, especially when it drives staffing, borrowing, inventory, dividends, or capital expenditure.
A range of plausible outcomes creates a more honest discussion. It also reveals whether a plan is resilient or succeeds only under favorable conditions.
🌦️ What Scenario Analysis Actually Does
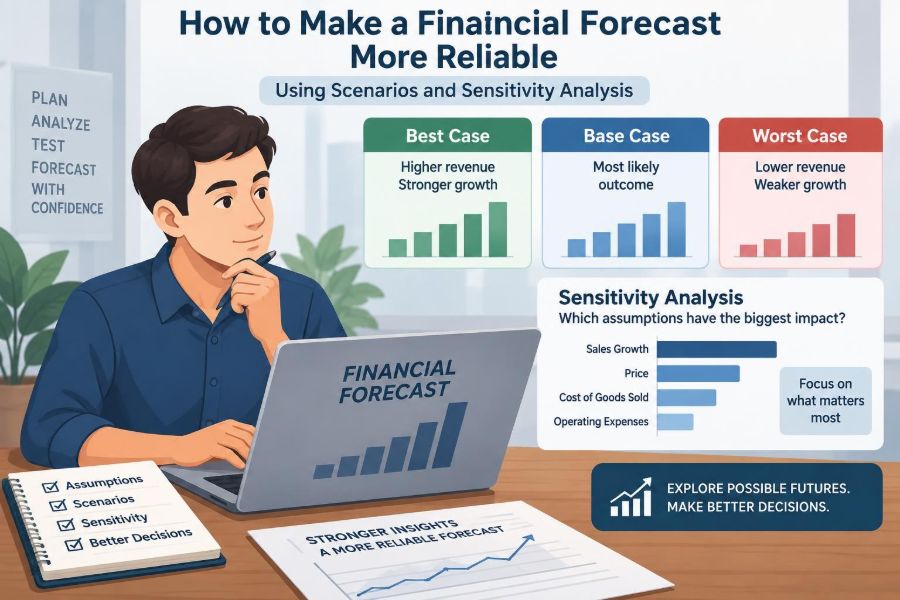
Scenario analysis evaluates a coherent set of assumptions that could occur together. Rather than changing one input in isolation, it tells a business story: demand slows, customers pay later, and management cuts discretionary spending.
Each scenario produces a complete set of financial consequences. Revenue may fall, gross margin may change, working capital may rise, and cash may tighten at different points. This connected view is what makes scenarios valuable.
Scenarios are hypothetical planning tools, not claims that a particular future will happen. Their purpose is to prepare choices under several credible conditions.
🔬 What Sensitivity Analysis Actually Does
Sensitivity analysis changes one assumption, or occasionally two related assumptions, while holding the other model inputs constant. It asks questions such as: “What happens to operating profit if gross margin falls by one percentage point?”
This isolates the financial importance of a variable. It is especially useful when management needs to know which assumptions deserve better data, closer monitoring, or contingency plans.
Its limitation is also clear: real events rarely move only one variable. A demand decline may affect volume, discounting, receivables, and inventory simultaneously. Sensitivity analysis explains exposure; scenarios explain a plausible combined outcome.
🔗 How the Two Methods Work Together
Start with sensitivity analysis to identify the model’s high-leverage assumptions. Then build scenarios around combinations that make operational sense.
For example, a sensitivity table might show that a change in customer payment days has a large effect on minimum cash. A downside scenario can then combine slower collections with modest sales growth and delayed cost actions.
This sequence avoids building elaborate scenarios around variables that barely matter. It also prevents leaders from mistaking an isolated sensitivity result for a realistic forecast.
🏗️ Build a Sound Base Case First
Scenarios cannot repair a weak core model. The base case needs clear revenue drivers, cost behavior, timing assumptions, working-capital logic, tax treatment where relevant, and links among the income statement, balance sheet, and cash flow statement.
Use assumptions that are observable and explainable. “Revenue grows 8%” is less informative than a driver-based view such as customers, units per customer, renewal rate, average price, and the timing of new sales.
A model should also pass basic integrity checks: balances reconcile, formulas are consistent across periods, and a change in a driver flows to the expected outputs.
🧩 Separate Drivers from Calculations
A dependable model separates inputs, calculations, and outputs. Drivers should be easy to locate and change without searching through formulas.
For a subscription business, drivers may include beginning customers, additions, churn, average monthly price, sales commissions, support headcount, collection days, and payment terms. The calculation area translates these assumptions into financial statements.
This design makes review easier and reduces the risk that a scenario changes a hard-coded number in one place but leaves related calculations unchanged elsewhere.
📌 Choose Assumptions That Truly Drive Outcomes
Not every line item deserves equal analytical effort. Focus on assumptions that are uncertain, material, and capable of changing a decision.
- Volume, customer growth, retention, or utilization
- Price, discounting, and product or customer mix
- Input costs, wage rates, and gross margin
- Collection days, inventory days, and supplier payment timing
- Hiring dates, capital expenditure, financing, and interest rates
Materiality depends on the business. A one-day collection delay may be minor for a cash-rich firm and critical for a rapidly growing company funding payroll from customer receipts.
🧠 Use Evidence Without Treating History as Destiny
Historical actuals are a starting point for assumptions, not an automatic answer. They can reveal seasonality, cost ratios, collections patterns, and the time it takes for sales activity to become revenue.
But a past trend may be distorted by a one-time contract, a discontinued product, a supply disruption, or a change in accounting classification. Ask what caused the historical result before projecting it forward.
External information can also matter, such as signed customer commitments, known price changes, contractual rent increases, or a planned facility opening. Record the basis for each significant input so reviewers understand the judgment behind it.
🧱 Define a Clear Base, Upside, and Downside
A simple three-scenario framework is often enough for management planning. The labels should describe conditions, not emotions: base case, upside case, and downside case.
| Scenario | Illustrative assumption pattern | Primary management question |
|---|---|---|
| Base | Expected demand and planned operating actions | What resources are needed to execute the plan? |
| Upside | Stronger conversion or earlier customer wins, with capacity pressure | Can the business deliver growth without damaging service or cash? |
| Downside | Lower demand, pressure on price, or slower collections | When are corrective actions required to protect liquidity? |
The goal is not symmetry. An upside scenario may require higher working capital, while a downside may expose fixed-cost commitments. Each should reflect the economics of the business.
📖 Make Every Scenario a Coherent Business Story
A scenario gains credibility when its assumptions connect. If sales volume falls because buyers are cautious, it may be inconsistent to assume receivables improve sharply without a specific reason.
Write a short narrative before editing the spreadsheet. For example: a manufacturer faces weaker orders in the first half, offers limited discounts to protect key accounts, reduces overtime after one month, and postpones nonessential equipment purchases.
The narrative is a control device. It helps reviewers challenge assumptions and makes it easier to explain outputs without reading every cell.
⚖️ Distinguish Scenario Design from Probability
Scenario analysis does not require assigning probabilities. In many business settings, there is not enough reliable evidence to say that one future has a precise likelihood.
It is reasonable to describe a case as plausible, severe but credible, or an internal planning stress. It is less defensible to attach an exact probability merely because the model requires a weighted average.
When probabilities are genuinely useful and supported by a defined method, they can inform expected-value calculations. They should not disguise subjective judgment as statistical certainty.
📈 Test Revenue Drivers Before Revenue Totals
Revenue is often the largest source of forecast uncertainty, so testing the total line alone is rarely enough. Break it into the operational mechanics that create it.
Consider a hypothetical retailer. Its sales forecast may depend on visitor traffic, conversion rate, average basket size, product availability, returns, and opening dates. A 5% sales reduction could arise from very different combinations of those drivers, with different responses available.
Driver-level analysis turns a vague revenue risk into practical questions: Should the company protect traffic, improve conversion, adjust inventory, or reconsider promotional discounts?
🧮 Understand Operating Leverage
Operating leverage describes how fixed costs amplify the effect of sales changes on operating profit. When payroll, leases, technology costs, or plant overhead remain largely fixed, a modest revenue decline can cause a larger profit decline.
This does not mean fixed costs are bad. They can create scale benefits when revenue grows. But a forecast should make the timing and flexibility of those commitments visible.
A useful downside case identifies which costs are truly variable, which can be reduced with delay, and which remain committed regardless of demand.
🏷️ Treat Price and Volume as Different Risks
Price and volume can produce the same revenue total but very different economics. A volume shortfall may leave unused capacity; a price reduction may directly reduce margin across all units sold.
Testing them separately helps management see the trade-off. If a business lowers price to preserve volume, the model should reflect any associated changes in commissions, production, customer acquisition, returns, and gross margin.
Do not assume a discount automatically generates enough demand to offset the margin loss. The relationship should be based on evidence where available and treated cautiously where it is not.
🛠️ Model Costs by Their Real Behavior
Forecast models commonly fail when every cost is projected as a fixed percentage of revenue. Some costs vary with units, some with headcount, some with activity levels, and some only change when a threshold is crossed.
Classify major costs in a practical way: variable, fixed, semi-variable, or step-fixed. A warehouse may need another supervisor only after volume reaches a threshold; software costs may rise when the team exceeds a license tier.
Scenario outputs become more believable when cost behavior reflects operating reality rather than a single historical ratio.
💧 Put Cash Flow at the Center
Profit does not pay invoices; cash does. A business can report forecast profit while facing a cash shortage if receivables grow, inventory builds, capital spending occurs early, or debt repayments fall due.
Every meaningful scenario should therefore include a cash flow view and a minimum cash balance by period. Monthly timing is usually more useful than annual totals when liquidity is a concern.
Ask not only “Is the business profitable?” but also “When does cash become tight, and what action must occur before then?”
⏱️ Stress-Test Working Capital Timing
Working capital represents the short-term operating assets and liabilities that tie up or release cash. Receivables, inventory, payables, deferred revenue, and accrued expenses can each materially change the funding need.
A simple sensitivity may vary days sales outstanding, the average time customers take to pay. In a scenario, slower collections could coincide with lower sales, making cash pressure more severe than either movement alone suggests.
Be careful not to use payment terms as if they guarantee payment timing. Actual collection behavior, billing accuracy, dispute rates, and customer concentration all matter.
🏦 Include Financing Constraints and Covenants
Forecasts used for treasury or financing decisions should reflect available facilities, repayment schedules, interest costs, and practical restrictions on borrowing. A cash balance is not a complete liquidity answer if a facility is nearly exhausted or subject to conditions.
Where debt agreements contain financial covenants, model the relevant definitions carefully. Covenant calculations can differ from headline accounting measures because agreements may specify adjustments, measurement dates, or particular definitions.
Do not assume that a projected breach will automatically produce a particular legal result. Escalate it early to finance leadership and appropriate advisers, using the actual agreement as the reference.
📊 Read Sensitivity Tables Correctly
A sensitivity table displays results across a range of assumptions. For instance, rows may show sales volume changes and columns may show gross-margin changes, with each cell showing operating profit or ending cash.
The table is not a forecast of all cells. It is a map of how the model behaves. Look for steep changes, break-even points, and areas where a modest movement causes a liquidity or covenant problem.
Choose outputs that match the decision. EBITDA may help assess operating performance, while minimum cash, free cash flow, or debt capacity may be more useful for financing decisions.
🚦 Find Thresholds, Not Just Differences
Management decisions are often triggered by thresholds rather than by a general decline in performance. Examples include the point at which cash falls below a policy buffer, a covenant headroom disappears, or a factory needs an additional shift.
Build sensitivities around these decision points. Instead of asking only how much profit changes, ask: “At what monthly revenue level must hiring pause?” or “How many collection days can cash absorb before financing is needed?”
This produces actionable early-warning indicators rather than an interesting but passive spreadsheet.
🪜 Use Reverse Stress Testing Carefully
Reverse stress testing starts with an unacceptable outcome and works backward to identify what combination of assumptions could cause it. The outcome might be a cash shortfall, a covenant breach, or a missed minimum return threshold.
For example, rather than selecting an arbitrary sales decline, determine the sales, margin, and collection changes that would bring minimum cash to zero. Then assess whether that combination is plausible and what mitigations are available.
This method is not a prediction of failure. It is a structured way to understand vulnerability and contingency requirements.
🗓️ Match the Forecast Horizon to the Decision
A forecast horizon should fit the decision being made. A weekly or monthly cash forecast may be necessary for near-term liquidity, while a capital investment may require several years to capture ramp-up, replacement costs, and returns.
Detail can decline over time. Near periods should use more operational data; distant periods may use broader assumptions. Pretending that month 36 is as precise as next month usually adds complexity without improving judgment.
A rolling forecast can help by adding a new period as each actual period closes, keeping attention on the future rather than only on the budget year.
🔄 Reforecast When New Information Arrives
Reforecasting is not an admission that the original plan failed. It is how a forecast stays useful as actual sales, staffing, costs, and cash collections reveal new information.
Update material drivers on a defined cadence, but avoid changing every assumption whenever a small variance appears. Distinguish a temporary fluctuation from evidence that the underlying outlook has shifted.
Keep prior forecast versions or a clear change log. This lets the team explain whether results changed because performance changed, assumptions changed, or model logic was corrected.
🧾 Compare Actuals with Forecasts to Learn
Variance analysis compares actual results with the forecast, but the objective should be learning rather than blame. A missed revenue target may stem from volume, price, mix, timing, churn, or recognition timing; each calls for a different response.
Review forecast error at the driver level. If conversion repeatedly differs from plan while average price is stable, the model should be improved where the evidence points.
Over time, this process develops institutional knowledge about which assumptions are difficult to estimate and which leading indicators provide earlier warning.
🧪 Keep Assumption Changes Auditable
Scenario work can become unreliable when users overwrite cells without a record. Use clearly labelled scenario controls, assumption sheets, or versioned files so another reviewer can reproduce the output.
For each material assumption, document the owner, source, date updated, rationale, and whether it is a fact, estimate, or management decision. This is especially helpful when multiple teams contribute inputs.
Good documentation does not eliminate judgment. It makes judgment reviewable, which is essential in finance and accounting environments.
🤝 Bring Operations into the Modeling Process
Finance understands the financial effects, but operational teams often understand the drivers best. Sales can explain pipeline quality, procurement can explain supplier risk, and operations can identify capacity limits or implementation delays.
Cross-functional input should be challenged, not copied. A sales target is not automatically a forecast, and a cost-saving proposal is not complete until timing, execution cost, and potential service effects are understood.
The most useful forecast conversations connect operational facts to accounting and cash-flow consequences.
🗣️ Present Results as Decisions, Not Spreadsheet Tours
Senior audiences usually need a concise narrative: the base outlook, the principal uncertainties, the downside exposure, the trigger points, and recommended actions. They rarely need every formula explained in the meeting.
A clear presentation might show one scenario comparison, one sensitivity table, a minimum-cash chart, and a short list of proposed decisions. Keep detailed schedules available for review.
Use plain language alongside technical measures. Saying “cash falls below the internal buffer in August if collections slow” is more useful than displaying a large model output without interpretation.
⚠️ Avoid Common Scenario-Planning Mistakes
Several errors reduce the value of otherwise sophisticated models:
- Changing only revenue: ignoring the effect on margin, working capital, commissions, and capacity.
- Using arbitrary percentages: applying a generic sales decline without an operational explanation.
- Double counting: reducing revenue and separately reducing costs that are already formula-linked to revenue.
- Ignoring timing: relying on annual totals when monthly cash is the real constraint.
- Creating too many cases: overwhelming decision-makers with minor variations rather than focusing on meaningful alternatives.
- Confusing a scenario with a commitment: treating a downside plan as the expected outcome or an upside as a target.
The remedy is usually not a more complex workbook. It is clearer drivers, stronger controls, and better questions.
🧭 Choose the Right Level of Complexity
A small business may need three scenarios and a few critical sensitivities. A larger organization with multiple products, currencies, financing arrangements, or supply chains may need more detailed models and formal governance.
Complexity is justified when it changes a decision or improves control. It is not justified merely because more data is available. A model that no one can review or update quickly may be less reliable than a simpler, well-governed one.
Start with the decision, then build only the level of detail needed to support it.
✅ A Practical Monthly Workflow
A repeatable process makes scenario analysis manageable rather than an occasional crisis exercise.
- Update actual results and reconcile the core model.
- Review the largest driver variances and newly available information.
- Refresh the base case using documented assumptions.
- Run sensitivities on the most uncertain and material drivers.
- Update a small number of coherent scenarios.
- Identify thresholds, actions, owners, and timing.
- Communicate conclusions and retain the assumptions used.
This cadence makes forecasting a feedback loop: plan, observe, learn, revise, and act.
🌟 The Core Principle: Make Uncertainty Useful
The strongest financial forecast is not the one with the most confident single number. It is the one that shows how operational assumptions flow through profit, cash, and financial risk.
Scenarios make combined uncertainties understandable. Sensitivity analysis identifies the assumptions with the greatest leverage. Together, they help managers prepare actions before outcomes force rushed decisions.
There will always be events a model cannot anticipate. The aim is not perfect foresight; it is a disciplined, transparent process that improves decisions when reality differs from plan.
A reliable forecast treats uncertainty as something to measure, discuss, and manage—not something to hide behind one precise-looking number. 💰📊🧭