
A manager asks whether the business can afford to hire two more people next quarter. A founder wants to know how much cash must be raised. An analyst is asked why a company can report a profit and still have less money in the bank.
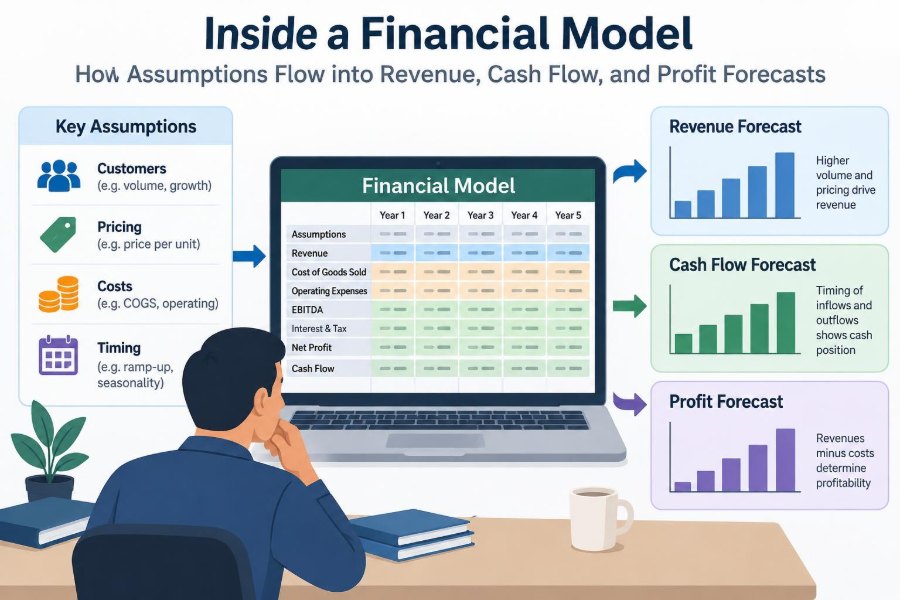
Those questions may sound separate, but a well-built financial model answers them through the same connected system. A small change in one operating assumption can travel through sales, expenses, working capital, cash flow, and the balance sheet.
That is why a financial model is more than a spreadsheet full of formulas. It is a structured explanation of how a business is expected to work under a defined set of assumptions.
Understanding that flow helps students read models critically and helps working professionals use forecasts as decision tools rather than as polished but fragile outputs.
🧭 What a Financial Model Actually Does
A financial model translates business assumptions into estimated financial statements. It usually projects the income statement, balance sheet, and cash flow statement over monthly, quarterly, or annual periods.
At its best, the model creates a clear chain: an input changes, an operational driver responds, and the resulting financial effect appears in the right statements. The point is not to predict the future perfectly. It is to make the logic behind a forecast visible, testable, and usable.
🔗 The Core Flow: Inputs, Drivers, and Outputs
Most models have three broad layers. Inputs are assumptions entered by the user. Drivers are calculations that turn assumptions into operating activity. Outputs are the financial results and decision metrics.
For example, an assumption that customer numbers will rise by 5% per month may drive projected orders. Orders drive revenue, revenue may drive accounts receivable, and receivables affect operating cash flow. One assumption therefore has several downstream consequences.
🏗️ Start With the Business, Not the Spreadsheet
Before building formulas, identify how the company creates value and collects cash. A retailer sells units from inventory; a consulting firm sells billable hours; a software company may receive subscriptions before delivering service over time.
The same spreadsheet structure should not be forced onto every business. Model drivers should reflect the actual economic engine. If the business is primarily constrained by sales staff, warehouse capacity, or available cash, that constraint belongs in the forecast.
🗂️ Separate Assumptions From Calculations
Strong models keep editable assumptions in clearly identified input areas and place calculations elsewhere. This reduces the risk that a user changes a formula when intending only to update a rate or price.
Typical assumptions include unit price, customer growth, staffing plans, payment terms, tax rates, capital expenditure, and borrowing rates. Each should have a source or rationale, even if it is simply a management judgment for a hypothetical scenario.
- Use consistent labels and units.
- Show whether percentages are monthly, quarterly, or annual.
- Distinguish actual historical results from forecast assumptions.
- Avoid hiding critical assumptions inside long formulas.
📅 Choose a Sensible Time Horizon
Forecast periods should match the decisions the model supports. A cash-constrained start-up may need monthly forecasts because a single delayed customer payment can matter. A mature business planning long-term capacity may use annual periods beyond its detailed budget year.
More detail is not always better. Monthly projections for five years can create an illusion of precision if the underlying assumptions are broad estimates. Many practical models use detailed near-term periods and more aggregated periods later.
🧱 Build Historical Results Before Forecasting
Historical financial statements provide the starting balance and reveal patterns worth investigating. Revenue trends, gross margins, collection periods, inventory levels, and expense behavior can all inform future assumptions.
History is evidence, not destiny. A past growth rate may be unsuitable if pricing, market conditions, capacity, or customer mix is changing. The useful question is: what caused the historical result, and will that cause persist?
🧮 Revenue Begins With an Operating Driver
Revenue is often modeled as a price-volume relationship. For a simple product business, the basic formula is:
Revenue = Units sold × Average selling price
For a service business, it might be billable employees multiplied by utilization, available hours, and billing rate. For subscriptions, it may depend on opening customers, new customer additions, churn, and average recurring revenue per customer.
The formula should be as simple as possible while still capturing the factors management can influence or observe.
🛒 Model Volume Before Assuming Sales Growth
A top-line growth percentage is quick to enter, but it can conceal the reason revenue is expected to increase. Volume-based modeling is usually more informative because it asks what will actually change: customers, transactions, units per transaction, capacity, or conversion rate.
Consider a hypothetical coffee shop. Sales may grow because it expects more customers, a higher average ticket, longer opening hours, or an additional location. Each explanation has different costs, operational requirements, and risks.
🏷️ Price Is a Separate Assumption
Price increases can lift revenue even when unit volume is flat. But a price assumption should not be treated as frictionless. Higher prices may affect customer demand, discounts, contract renewals, or product mix.
Where material, a model can separate list-price movement from discounting. This prevents an average price forecast from masking a plan that depends on both a large stated price increase and unusually stable discount levels.
🔁 Account for Customer Retention and Churn
For recurring-revenue businesses, customer retention often matters as much as new sales. Churn is the loss of customers or recurring revenue over a period. A customer forecast should reconcile opening customers, additions, losses, and closing customers.
Closing customers = Opening customers + New customers − Churned customers
A model that forecasts strong new sales but ignores churn may overstate future revenue. Conversely, a retention improvement can compound over time because more customers remain available to renew.
📦 Recognize Revenue in the Correct Period
Cash received is not automatically revenue. Under accrual accounting, revenue is generally recognized when the business has performed its obligation to provide goods or services, subject to the applicable accounting framework and contract terms.
A customer who prepays for a year of service may create cash immediately, while revenue is recognized over the service period. This distinction is central to understanding why profit, revenue, and cash can move differently.
🧾 Connect Revenue to Accounts Receivable
When a company invoices customers but has not yet collected cash, the amount owed is recorded as accounts receivable. Revenue may increase this balance before it increases cash.
A common forecasting approach uses days sales outstanding, or DSO, which estimates average collection time. If forecast revenue rises while collection days remain unchanged, receivables generally rise too. That increase uses cash in the cash flow statement.
🧰 Cost of Sales Follows the Delivery Model
Cost of sales, also called cost of goods sold in many product businesses, includes costs directly connected to delivering revenue. For a manufacturer, this could include materials and production labor. For a software business, it might include hosting and customer support costs associated with serving users.
Some costs vary with sales, while others change in steps. Delivery costs may increase proportionally with units, but a new production shift or support team may be required only after volume reaches a threshold.
📉 Gross Profit Reveals Unit Economics
Gross profit equals revenue less cost of sales. Gross margin expresses gross profit as a percentage of revenue and helps show how much revenue remains to cover operating expenses, financing costs, and taxes.
Higher revenue does not automatically mean a healthier business. A company can grow sales while lowering gross margin through heavy discounting, unfavorable product mix, higher input costs, or costly customer acquisition channels that are incorrectly classified.
👥 Forecast Operating Expenses by Their Behavior
Operating expenses include selling, general, administrative, research, and other costs needed to run the business. Forecasting them as one percentage of revenue is sometimes reasonable for an early estimate, but it is often too blunt for management planning.
Classify material expenses by behavior:
- Fixed costs: expenses that are relatively stable within a relevant range, such as a fixed office lease.
- Variable costs: expenses that broadly move with activity, such as sales commissions.
- Step costs: costs that stay flat until capacity is reached, then rise, such as adding a manager or warehouse shift.
This structure makes the forecast more believable and makes decisions easier to test.
🧑💼 Turn Headcount Plans Into Payroll Costs
Headcount is frequently one of the largest forecast drivers. A useful payroll schedule includes opening employees, hires, departures, timing of each change, salary or wage rates, and employer costs where relevant.
Hiring in April should not produce a full year of salary expense in a monthly model. Timing matters. It also affects cash, because recruiting fees, signing bonuses, equipment, and training costs may occur before a new employee generates revenue.
🏢 Include Capacity and Operational Constraints
A revenue forecast should respect what the business can deliver. A hotel cannot sell more rooms than it has available; a consulting firm cannot bill more hours than its people can work; a factory cannot exceed its usable production capacity without overtime, new equipment, or expansion.
When projected demand exceeds capacity, the model needs a response: lost sales, lower service levels, overtime expense, capital investment, outsourcing, or additional staff. Ignoring the constraint can make revenue and profit forecasts internally inconsistent.
🏭 Plan Capital Expenditure and Depreciation Separately
Capital expenditure, often shortened to capex, is spending on long-lived assets such as equipment, vehicles, systems, or facilities. Capex is generally a cash outflow when paid, but it is not normally recorded immediately as a full operating expense.
Instead, the asset is depreciated or amortized over its useful life under the applicable accounting policy. The model should therefore contain an asset schedule that links capex, depreciation, closing asset balances, and cash spending.
🪜 Understand the Difference Between EBITDA and Profit
EBITDA is earnings before interest, taxes, depreciation, and amortization. It can help compare operating performance before certain financing and non-cash accounting effects, but it is not the same as cash flow or net profit.
A business with positive EBITDA may still require substantial cash for inventory, receivables, tax payments, debt service, or equipment. It may also report lower net income after depreciation, interest, and taxes. Treat EBITDA as one lens, not a complete diagnosis.
💳 Add Financing Assumptions Carefully
Debt schedules should reflect opening balances, new borrowings, required repayments, interest rates, and timing. Interest expense typically flows to the income statement, while borrowings and principal repayments appear in financing cash flows.
Interest may depend on the amount of debt outstanding, which itself depends on cash needs. This can create a circular reference in a spreadsheet. Some models solve this with an average debt balance, an iterative calculation setting, or a simplified assumption; the chosen method should be transparent.
🏦 Working Capital Is Where Profit Meets Cash
Working capital is commonly understood as short-term operating assets less short-term operating liabilities. In a forecast, the most influential components are often receivables, inventory, payables, deferred revenue, and accrued expenses.
Growing businesses often need more working capital. They may pay suppliers for inventory or labor before collecting from customers. That can create a cash shortfall even when the income statement shows rising revenue and profit.
📦 Inventory Can Absorb Cash Quietly
Inventory is purchased before it is sold. If sales are expected to grow, a product business may need to build stock in advance, especially when suppliers have long lead times or demand is seasonal.
Too little inventory risks missed sales; too much inventory ties up cash and can create write-down risk if goods become obsolete. A forecast should connect inventory to expected sales, purchasing policy, lead times, and the chosen inventory valuation approach.
🤝 Supplier Terms Create a Different Timing Effect
Accounts payable represents amounts owed to suppliers. Longer payment terms can preserve cash in the short term because the company keeps funds longer before paying. However, this is not free financing in every circumstance.
Stretching payments beyond agreed terms can harm supplier relationships, reduce discounts, interrupt supply, or signal distress. A realistic forecast uses expected contractual and operational payment behavior, not an assumption that suppliers will indefinitely absorb the company’s cash needs.
💵 Build the Cash Flow Statement From the Model
The cash flow statement explains changes in cash through operating, investing, and financing activities. A forecast usually begins with profit, adjusts for non-cash items such as depreciation, and incorporates changes in working capital to derive operating cash flow.
Investing cash flow includes items such as capex. Financing cash flow includes debt drawdowns, repayments, and equity funding. The ending cash balance must equal beginning cash plus the net movement in cash for every forecast period.
⚖️ Link the Three Financial Statements
The income statement measures performance over a period. The balance sheet shows assets, liabilities, and equity at a point in time. The cash flow statement explains the movement in cash between those points.
These statements cannot be built independently. Net income affects retained earnings, depreciation affects both profit and asset balances, capex affects fixed assets and cash, and changes in receivables affect the balance sheet and operating cash flow.
A basic integrity check is:
Assets = Liabilities + Equity
If the balance sheet does not balance, the model contains a missing link, formula error, sign error, or incomplete assumption.
🔍 Trace One Assumption Through the Entire Model
Imagine a hypothetical distributor expects unit sales to increase next month. The immediate effect is higher revenue. If gross margin remains constant, gross profit also rises. But additional sales may require more inventory purchases and create more receivables if customers buy on credit.
The result may be higher accounting profit but weaker near-term operating cash flow. If the cash balance falls below the company’s minimum level, the model may require extra borrowing, which increases interest expense and reduces later net profit. This is the connected logic a model should reveal.
🎛️ Use Scenarios Instead of One “Certain” Forecast
A forecast is conditional. Scenario analysis changes a coherent set of assumptions to show possible outcomes, such as a base case, a downside case, and an upside case.
A downside case should not simply reduce revenue by an arbitrary amount. It should describe a plausible mechanism: slower customer acquisition, lower pricing, higher churn, delayed collections, or increased input costs. That makes the scenario useful for planning rather than merely alarming.
📊 Test Sensitivities Around Key Uncertainties
Sensitivity analysis changes one input while holding other assumptions constant. It helps identify which assumptions have the largest effect on an output such as ending cash, net income, or debt requirement.
For example, a business may test the effect of slower collections, a lower gross margin, or a delayed hiring plan. The exercise does not tell management what will happen; it shows where the forecast is most exposed and where better information has the greatest value.
🚨 Watch for Common Modeling Failures
Many model errors are not complex mathematical mistakes. They are broken business logic, inconsistent timing, and assumptions that appear in only one place.
- Applying annual growth rates directly to monthly periods without conversion.
- Recording capex as both an expense and an investing cash outflow.
- Forecasting revenue without the receivables or deferred-revenue effect.
- Using a percentage of revenue for costs that are actually driven by headcount or capacity.
- Hard-coding numbers inside formulas, making changes difficult to trace.
- Allowing the balance sheet to stop balancing without investigating why.
✅ Validate the Model With Practical Checks
Validation is a discipline, not a final cosmetic step. Check whether opening balances agree to the prior period’s closing balances, whether cash rolls forward correctly, and whether every statement link works.
Then perform reasonableness checks. Ask whether headcount can support projected sales, whether payment terms resemble actual contracts, whether margins move for a stated reason, and whether borrowing remains within available facilities. A model can balance mathematically and still be commercially unrealistic.
🗣️ Present Forecasts With Their Assumptions
Decision-makers usually need more than an output chart. They need to understand the few assumptions driving the result, the timing of the cash low point, the key risks, and the actions that could change the outcome.
A concise forecast discussion may cover revenue drivers, margin assumptions, working-capital needs, funding requirements, and scenario differences. Clear communication prevents a single forecast number from being mistaken for a promise.
🧠 The Core Principle: Follow the Economic Story
A reliable financial model follows the economic story of the business. It begins with operational realities, converts them into revenue and costs, recognizes the timing differences between profit and cash, and keeps the three statements linked.
The most useful models are not those with the most tabs or the most elaborate formulas. They are models whose assumptions can be understood, challenged, updated, and traced all the way to profit, cash, and financial position.
When you can follow an assumption from a real business decision through revenue, working capital, cash flow, and profit, you are no longer just reading a spreadsheet—you are understanding the business behind it. 💰📊🔗