
It is Friday afternoon, and the finance team is still reconciling spreadsheet versions. Sales has sent a revised pipeline file, operations has changed its hiring plan, and the chief financial officer wants an updated cash forecast before Monday. The numbers may be correct eventually, but the time spent collecting, cleaning, and reformatting them is time not spent interpreting what they mean.
For many students, this sounds like an advanced corporate problem. Yet the same pattern appears in smaller settings: a student organization tracking event costs, a freelancer estimating next quarter’s income, or a manager deciding whether a new project can fit the budget.
Financial forecasting and reporting have always required judgment. What is changing is the amount of routine work that software can perform before a human accountant or analyst begins that judgment.
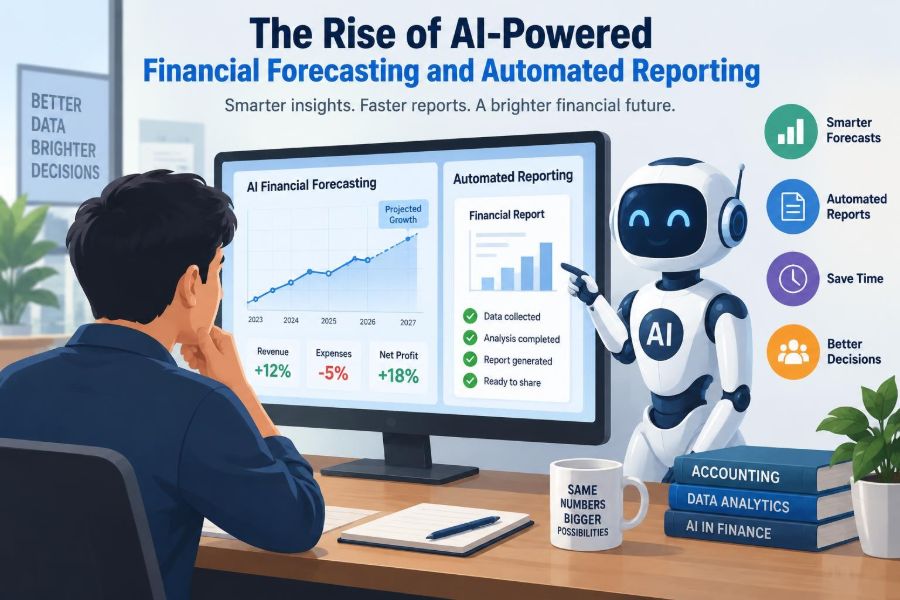
AI-powered forecasting and automated reporting are becoming practical tools for finance teams. Used carefully, they can shorten reporting cycles, reveal patterns earlier, and make finance a more active partner in business decisions. Used carelessly, they can make errors move faster and appear more convincing.
📈 What AI-powered financial forecasting means
Financial forecasting is the process of estimating future financial results, such as revenue, expenses, cash balances, or demand. Traditional forecasts often begin with prior-period results and assumptions entered into a spreadsheet.
AI-powered forecasting uses machine-learning methods, statistical models, or generative AI tools to help find patterns, produce projections, explain movements, or prepare forecast materials. It does not mean a system can know the future. It means the system can process more relevant signals and update estimates more efficiently than a purely manual workflow.
🧾 Automated reporting is more than exporting a PDF
Automated reporting connects data sources to repeatable rules, calculations, narratives, and output formats. A monthly management report might pull actual results from an accounting system, compare them with budget, flag unusual variances, and populate a dashboard or presentation.
The valuable part is not simply faster formatting. It is the creation of a controlled process in which the same definitions, mappings, and calculations are applied consistently each time.
🧠 The difference between automation and AI
These terms are related but not interchangeable. Automation follows a specified instruction: if an invoice is approved, send it to the next workflow step. AI can identify patterns or generate an output when the rule is not completely spelled out.
| Capability | Typical task | Main limitation |
|---|---|---|
| Rules-based automation | Refresh a report on a schedule | Needs clear, predefined rules |
| Statistical forecasting | Project seasonal sales from historical data | May miss a structural business change |
| Machine learning | Use many drivers to estimate demand | Needs reliable, relevant training data |
| Generative AI | Draft a variance explanation | Can produce plausible but incorrect text |
Most strong finance workflows combine these approaches. Automation moves data; forecasting models estimate outcomes; people test whether the result makes business sense.
⏱️ Why the timing of finance work is changing
Businesses now create transactions and operational data continuously through payment platforms, customer systems, payroll tools, inventory systems, and banking feeds. Waiting until month-end to learn what happened can leave management reacting late.
Faster reporting does not require abandoning the close process. It means building a flow in which preliminary information is available earlier, while controlled close procedures still establish the official record.
🔄 From periodic forecasts to rolling forecasts
An annual budget remains useful for setting direction and accountability, but it can become stale when assumptions change. A rolling forecast regularly extends the planning horizon, such as always forecasting the next 12 months.
AI tools can make rolling forecasts less labor-intensive by refreshing data, re-estimating recurring patterns, and identifying assumptions that need review. The planning team still decides whether a recent change is temporary or likely to continue.
🗂️ The data foundation comes first
No model can repair a finance process built on unclear or inconsistent data. If one department calls a customer “enterprise” and another calls the same customer “strategic,” a revenue forecast may combine unlike categories.
Useful forecasting data commonly includes general ledger actuals, sales pipeline information, invoices, payroll records, inventory activity, payment terms, and operating metrics. The right mix depends on the question being forecast.
🏷️ Chart of accounts design affects forecast quality
The chart of accounts is not merely an accounting structure; it is a language for analysis. If material costs, contractor costs, and freight costs are all buried in a broad expense account, managers cannot easily see which driver is changing.
Good design balances detail with maintainability. Creating too many accounts can make coding inconsistent, while too little detail limits analysis. Dimensions such as department, product line, location, and project can often provide better insight than adding endless accounts.
🧹 Data cleaning is a finance control, not a technical chore
Before analysis, data often needs duplicate removal, standardized dates, corrected account mappings, and checks for missing fields. These tasks may feel unglamorous, but they directly affect whether a model is trustworthy.
A simple example is a vendor recorded under two spellings. An expense model may treat them as separate suppliers and miss a concentration risk. Reconciliation and data-quality checks remain essential even when data preparation is automated.
🎯 Choosing the question before choosing the model
“Forecast the business” is too broad to be useful. A better request identifies an outcome, horizon, level of detail, and decision: forecast weekly cash receipts for the next 13 weeks to plan borrowing needs.
Clear questions prevent false precision. A model capable of estimating total monthly revenue may not reliably forecast each individual sales representative’s results.
🌦️ Common forecasting methods in practice
Different financial patterns call for different methods. The most sophisticated approach is not always the most appropriate one.
- Run-rate forecasting extends recent performance and works best when conditions are stable.
- Driver-based forecasting links results to operational inputs, such as units sold, headcount, or utilization.
- Time-series forecasting uses trends and seasonality in historical observations.
- Scenario forecasting estimates outcomes under distinct assumptions, such as a delayed product launch or price change.
AI may help select patterns or combine inputs, but finance teams should understand the underlying logic well enough to challenge it.
🔗 Driver-based models connect operations to finance
A driver-based model begins with the activities that cause financial outcomes. For example, a subscription business might forecast revenue from customer count, churn, new bookings, price, and contract timing.
This approach is often easier to explain than a purely statistical projection. If revenue changes, management can discuss whether the issue is conversion, retention, pricing, or implementation capacity rather than debating a black-box number.
💵 Cash forecasting requires different thinking
Profit and cash are related but not identical. Revenue can be recognized before cash is collected, and an expense can be recorded before payment is due. A profitable company can still experience a cash shortfall.
A useful cash forecast considers invoice due dates, expected collection behavior, payroll timing, tax payments, debt service, planned capital spending, and supplier terms. AI can identify payment patterns, but unusual customer situations often require direct input from credit and collections teams.
🔍 Variance analysis becomes more targeted
Variance analysis compares actual results with a benchmark such as budget, prior period, or forecast. Automated systems can rank the largest changes, drill into account details, and surface recurring patterns.
The goal is not to generate more alerts. It is to direct human attention toward changes that are material, unusual, or decision-relevant. A small variance in a volatile account may deserve less attention than a moderate variance that signals a failing pricing assumption.
📝 AI-generated narratives need evidence
Generative AI can draft an explanation such as: “Marketing expense exceeded plan because campaign spending increased in the western region.” That can save time, but the statement must be traceable to data and reviewed by someone who understands the business.
A safe workflow gives the tool approved tables, defined metrics, and a limited task: summarize the top verified variances. It should not be asked to invent causes where the data shows only correlation.
🚨 Anomaly detection can support review
An anomaly is an observation that differs meaningfully from an expected pattern. In finance, examples include an unusually large journal entry, a duplicate payment pattern, or a sudden shift in gross margin.
Anomaly detection is a prioritization tool, not proof of fraud or error. Seasonal spikes, one-time projects, and valid corrections can all look unusual. Each alert needs context, documentation, and appropriate follow-up.
📊 Dashboards should answer decisions, not display everything
A dashboard can be visually impressive and still unhelpful. The best dashboards are designed around a small number of decisions: whether to adjust hiring, accelerate collections, revise inventory purchases, or investigate a margin decline.
For each measure, users should know the definition, data source, reporting period, refresh time, and comparison basis. A number without context can create false confidence.
🧩 Integrating systems without losing control
Forecasting often requires data from enterprise resource planning systems, customer relationship management tools, payroll applications, banking platforms, and spreadsheets. Integration reduces manual copying, but it introduces dependencies between systems.
Teams should document data flows, refresh schedules, transformations, and owners. If a source system changes a field or an application programming interface fails, the report should show that a refresh did not complete rather than quietly presenting stale data.
🔐 Privacy and confidentiality are central design requirements
Financial data can include salary details, customer balances, bank information, pricing, and strategic plans. Sending such information into an AI tool without understanding its data handling arrangements can create serious confidentiality and compliance concerns.
Organizations need policies for approved tools, access rights, retention, encryption, and data classification. Where possible, use the minimum data needed for the task and remove personally identifiable information from development and testing datasets.
🧾 Audit trails preserve accountability
An audit trail records what data was used, when a report was refreshed, which logic was applied, and who approved significant changes. This is especially important when models influence financial decisions or reporting.
Version control also matters. A forecast should not change silently because someone altered a mapping or assumption. Clear logs make review easier and help teams learn why a forecast differed from actual results.
⚖️ Controls must evolve with the tools
Automation can reduce manual errors, but it can also repeat an incorrect rule at scale. Finance controls should test inputs, transformations, outputs, access permissions, and exceptions.
- Reconcile automated totals to trusted source records.
- Set approval thresholds for changes to models and mappings.
- Separate the ability to modify logic from the ability to approve results.
- Review exceptions and failed refreshes promptly.
- Test whether outputs remain reasonable after major business changes.
These controls are not obstacles to speed. They are what make speed usable.
🧪 Backtesting measures whether a forecast earns trust
Backtesting compares previous forecasts with what actually happened. It helps a team assess bias, identify where a model performs poorly, and decide whether its assumptions need revision.
Accuracy should be examined by category and horizon. A model may be adequate for total quarterly expenses but weak for weekly cash receipts. Reporting one overall accuracy figure can hide this difference.
⚠️ Forecast error is unavoidable
A forecast is an estimate based on available information, not a commitment that outcomes will occur. New competitors, supply disruptions, policy changes, contract cancellations, and management decisions can all change results.
Rather than presenting one number as certain, teams can show a base case and a reasonable range or set of scenarios. This encourages discussion of assumptions and contingency actions.
🪞 Bias can enter through data and judgment
Historical data reflects past choices and conditions. If a company consistently underinvested in a region, historical sales alone may understate future potential after a strategic expansion.
Human judgment can also introduce optimism, anchoring, or pressure to meet a target. A disciplined process documents key assumptions, assigns owners, and distinguishes a management target from an unbiased expected outcome.
👥 Finance roles are shifting, not disappearing
Routine compilation work is increasingly automated, but that raises the value of capabilities that machines do not independently provide: accounting judgment, business understanding, skepticism, communication, and ethical responsibility.
Accountants and analysts may spend more time explaining variances, designing controls, testing data quality, partnering with operating teams, and translating uncertainty into useful decisions. Technical literacy matters, but it complements rather than replaces core accounting knowledge.
🎓 Skills students and professionals can build now
Start with strong fundamentals: financial statements, accrual accounting, budgeting, internal controls, and spreadsheet logic. Then add practical data skills, such as structured data tables, data visualization, basic querying, and model documentation.
It is also valuable to practice asking precise questions. Instead of requesting “an AI forecast,” define the business decision, available data, acceptable error, reviewer, and action to take if the forecast changes.
🏗️ A sensible implementation path
Organizations do not need to automate every finance process at once. Begin with a recurring, time-consuming report that has a stable definition and accessible data, such as a monthly budget-versus-actual package.
- Map the current process and identify manual handoffs.
- Define data owners, metric definitions, and reconciliation checks.
- Automate data collection and repeatable calculations first.
- Pilot forecasting or narrative features on a limited scope.
- Compare outputs with existing methods and document results.
- Expand only after controls, training, and review responsibilities are clear.
A phased approach makes it easier to detect problems before they affect high-stakes decisions.
🛑 Common implementation mistakes
One frequent mistake is treating a tool demonstration as proof that the process is ready for production. A polished forecast can still rely on incomplete data, unclear definitions, or untested assumptions.
Other avoidable errors include automating a flawed manual process, giving too many users editing access, ignoring exception reports, and measuring success only by hours saved. Better measures include timeliness, reconciliation quality, forecast usefulness, and decision adoption.
🤝 Human review remains the last responsible step
Managers know information that may not exist in the data: a major customer is delaying an order, a supplier is changing terms, or a planned hiring freeze has been approved. A model cannot reliably infer every such fact.
The strongest process is therefore human-in-the-loop: technology prepares, calculates, identifies, and drafts; accountable professionals review, challenge, approve, and communicate. Responsibility cannot be delegated to an output.
🌱 The practical future of finance teams
The likely future is not a fully autonomous finance function. It is a more connected one, where routine reporting is faster, forecasts update more often, and professionals have more capacity to investigate the decisions behind the numbers.
Teams that gain the most will treat AI as part of a broader operating model involving data governance, controls, skills, and clear accountability. The tool matters, but the process around it matters more.
✅ The core principle: faster insight requires stronger judgment
AI-powered forecasting and automated reporting can make finance more timely, consistent, and analytical. They can reduce repetitive work and help teams spot questions that deserve attention before month-end.
But a fast answer is useful only when its inputs are reliable, its assumptions are visible, and its implications are reviewed by people who understand both accounting and the business. The objective is not to remove judgment from finance; it is to focus judgment where it has the greatest value.
The most reliable finance systems combine sound accounting, trustworthy data, thoughtful automation, and accountable human judgment. That combination turns faster reports into better decisions rather than merely quicker numbers. 📊🤖💰