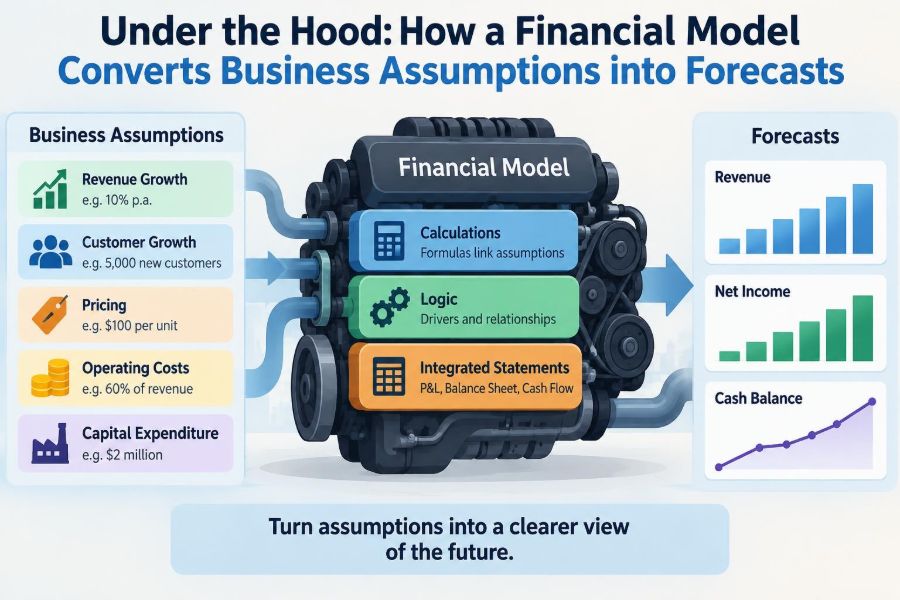

A founder says sales will grow because a new product is launching. A department leader expects to hire three people. A lender asks whether the business can repay debt if customer payments slow down. Each statement sounds reasonable on its own.
A financial model is where those statements must become connected numbers. It turns a plan into revenue, costs, profit, cash flow, and a balance sheet that can be reviewed, challenged, and changed.
That conversion is more demanding than filling in a spreadsheet. A model has to respect timing, accounting relationships, operating constraints, and uncertainty. If one assumption changes, the consequences should travel through the model logically.
Understanding that machinery helps students see why financial statements behave as they do, and helps professionals build forecasts that support decisions rather than merely decorate a presentation.
🧭 A financial model is a decision system
A financial model is a structured representation of how a business operates financially. It uses inputs about customers, prices, costs, assets, financing, and timing to estimate future results.
Its purpose is not to predict one exact future. The useful purpose is to make assumptions explicit and show their implications. Management can then ask better questions: What must happen to meet the plan? Which condition puts cash at risk? What decision changes the outcome most?
A spreadsheet is a common container, but a spreadsheet alone is not a model. A collection of manually typed forecast totals may look polished while lacking the formulas and relationships needed for analysis.
🏗️ The model starts with a business story
Before formulas, there is an operating story. A retailer opens stores and sells inventory. A software company acquires subscribers and collects recurring fees. A manufacturer converts materials and labor into units that are sold through distributors.
The story identifies the economic drivers: the few activities that create revenue, consume resources, and determine cash timing. A strong model follows those drivers instead of beginning with a guessed net-income number.
For example, a café forecast may begin with daily customer visits, average transaction value, opening days, food cost, staffing hours, and rent. Those inputs are closer to how the café is actually managed than a single “sales growth” percentage.
🎯 Assumptions are inputs, not conclusions
An assumption is an estimate or policy used to calculate a future outcome. It might be a price increase, sales conversion rate, wage rate, payment term, or planned capital expenditure.
The distinction matters because assumptions should be visible and reviewable. If a manager disagrees with a projected 20% revenue increase, they should be able to find the customer, volume, price, or capacity assumption causing it.
Good models separate assumptions from calculations. Inputs are often placed on dedicated sheets or clearly marked areas; formulas then pull from those cells. This reduces hidden hardcodes, where a number is typed inside a formula and becomes difficult to find later.
🧱 Build from drivers before financial statements
Driver-based modeling translates operational activity into financial outputs. Rather than forecasting revenue directly, the model forecasts the components that generate it.
Consider a hypothetical subscription business. Monthly revenue can be calculated from beginning subscribers, new subscribers, customer churn, and average monthly subscription price. New subscribers may itself depend on marketing leads and the conversion rate from lead to paid customer.
This structure allows a practical conversation. Is growth expected because marketing spend rises, conversion improves, churn falls, prices increase, or some combination? Each explanation has different cost, risk, and feasibility implications.
📦 Volume and price create the revenue engine
For many businesses, the basic revenue relationship is straightforward:
Revenue = Units sold × Average selling price
“Units” can mean physical products, billable hours, occupied hotel rooms, customer accounts, transactions, or licenses. The appropriate unit depends on the business model.
A model should also account for discounts, returns, cancellations, and revenue recognition rules when they are material. A sales order is not automatically accounting revenue, and cash received is not always revenue in the same period.
Separating volume from price is especially useful. A 10% revenue increase from higher unit volume may require inventory and labor; a 10% increase driven by price may affect demand differently. The headline total hides that distinction.
🗓️ Timing turns plans into a forecast
Financial models organize assumptions by time period, commonly months, quarters, or years. Monthly models are often needed when payroll, inventory purchases, or debt payments make liquidity sensitive. Annual models may be sufficient for a high-level long-range strategy.
Timing is not merely a formatting choice. A product launch in March has nine months of first-year sales, not twelve. A person hired in October contributes only part of a year’s salary. A new machine may be paid for upfront but depreciated over several years.
Every assumption should answer a timing question: when does it start, how quickly does it ramp, and when does it end or renew?
📈 Growth is usually a sequence, not a switch
Forecasts become misleading when they assume a full run rate immediately. New stores need time to build traffic, new sales representatives need time to become productive, and a marketing campaign may produce leads before it produces revenue.
A ramp is the planned progression from an initial level to a steady-state level. It can be modeled using monthly percentages, cohorts, production capacity, or a simple phased schedule.
For example, a new service team might operate at 40% of target capacity in its first month, 65% in its second, and reach normal capacity later. Those percentages are hypothetical planning assumptions, not facts; they should be tested against operational experience where available.
🧾 Revenue recognition can differ from billing
Accounting forecasts need to distinguish between earning revenue and issuing an invoice. Under accrual accounting, revenue is generally recognized when the promised goods or services are transferred or provided, subject to the applicable accounting framework and contract terms.
A business that bills an annual software subscription upfront may receive cash in January but recognize the service revenue over the subscription period. The unearned portion is recorded as a liability, often called deferred revenue.
This is why a model may show different schedules for bookings, invoices, cash collections, and recognized revenue. Combining them without thought can overstate current-period performance or understate future obligations.
⚙️ Cost of sales follows the delivery model
Cost of sales, also called cost of goods sold or cost of revenue, captures the direct costs of providing what was sold. For a retailer, this is largely the inventory purchased for resale. For a consulting firm, it may include delivery payroll and subcontractors.
Many costs can be linked to revenue drivers: material cost per unit, shipping per order, payment-processing fees as a percentage of sales, or support cost per active customer. These relationships produce a gross-margin forecast.
Not every delivery cost varies perfectly with sales. A factory may need a baseline production team even at low output. A model should combine variable costs with fixed or step-fixed capacity costs where that better matches reality.
👥 Operating expenses need operating logic
Sales, general, and administrative expenses often include payroll, rent, marketing, professional fees, software, and travel. Some can be forecast as a percentage of revenue, but that shortcut is not always reliable.
Headcount-based planning is often stronger for people-intensive companies. The model can calculate salary, payroll taxes, benefits, commissions, and start dates by role or department. Marketing may be tied to campaigns, leads, or a fixed budget rather than sales alone.
Percent-of-revenue assumptions remain useful for smaller or less material categories. The key is to document why a cost moves with revenue, with headcount, with time, or with a discrete business event.
🪜 Fixed, variable, and step costs behave differently
Cost behavior determines how profit changes as sales change. Variable costs generally rise with activity. Fixed costs remain stable within a relevant operating range. Step costs jump when the business crosses a capacity threshold, such as hiring another supervisor or leasing additional warehouse space.
| Cost type | Typical relationship | Illustrative example |
|---|---|---|
| Variable | Moves with units or revenue | Card processing fee per sale |
| Fixed | Stable over a planned period | Office lease payment |
| Step-fixed | Rises after a capacity threshold | Additional shift manager |
A model that treats every expense as a fixed percentage of sales can miss the economics of scale. It may also falsely imply that costs fall smoothly when revenue declines, even though payroll or leases cannot be reduced immediately.
📊 Gross margin and operating margin answer different questions
Gross margin measures what remains after direct delivery costs. It shows whether the basic offering is economically attractive before broader operating expenses.
Operating margin goes further, subtracting operating expenses such as sales, research, and administration. A company can have strong gross margins and still report operating losses while it invests in growth or carries an oversized cost base.
Keeping these layers separate helps diagnose performance. Falling gross margin may point to pricing, product mix, supplier costs, or delivery efficiency. Weak operating margin with stable gross margin may point to overhead or investment choices.
🏭 Capacity prevents impossible forecasts
Revenue assumptions must be checked against the ability to deliver. A restaurant has seats and service hours. A factory has machine hours and labor shifts. A professional-services firm has billable staff and available working time.
Suppose a consulting team has ten consultants, each expected to provide a realistic number of billable hours after allowing for holidays, training, sales support, and administration. A revenue target that requires more hours than the team can supply is not a forecast; it is an unaddressed staffing requirement.
Capacity constraints can be modeled as a limit, or as a trigger that adds equipment, employees, outsourcing costs, or delayed delivery.
📦 Working capital links profit to cash
A profitable business can still face a cash shortage. The reason is often working capital: short-term operating assets and liabilities such as receivables, inventory, payables, and deferred revenue.
When sales are made on credit, revenue may be recognized before cash arrives, creating accounts receivable. When inventory is bought before sale, cash is spent before the related revenue is recorded. When suppliers are paid later, accounts payable temporarily preserve cash.
Forecasting these balances is essential because rapid growth frequently consumes cash. More sales can mean more unpaid customer invoices and more inventory sitting on shelves.
⏳ Days assumptions make working capital tangible
Models often translate collection and payment practices into days-based assumptions. Days sales outstanding estimates how long customers take to pay; inventory days estimates how long inventory remains before sale; days payable outstanding estimates the time taken to pay suppliers.
These measures are approximations, not universal laws. Seasonality, customer concentration, product mix, contractual terms, and billing practices can make a simple days calculation less precise.
Still, they are useful planning levers. If a business shortens collection time, cash may improve without increasing revenue. If it extends supplier payment terms, cash may improve temporarily but supplier relationships and early-payment discounts should be considered.
🏦 Cash flow is not the income statement
The income statement reports revenue and expenses for a period. The cash flow statement explains the movement in cash. The difference comes from non-cash expenses, working-capital changes, investing activity, and financing activity.
Depreciation is a classic example. It reduces accounting profit but does not usually create a new cash payment in the period it is expensed. Buying the underlying asset, however, typically requires cash when the purchase occurs.
A complete forecast should show whether the business has enough cash to execute the plan, not just whether it reports a profit at year-end.
🧮 Capital expenditure creates assets, then depreciation
Capital expenditure, often shortened to capex, is spending on long-lived assets such as equipment, vehicles, buildings, or certain technology investments. It is generally recorded initially on the balance sheet rather than entirely as an immediate operating expense.
The asset is then depreciated or amortized over its expected useful life under the applicable accounting policies. This creates a timing difference between cash outflow and expense recognition.
Models should use a capex schedule that records planned purchases, useful lives, depreciation timing, disposals where relevant, and the resulting asset balance. Simply placing a capex number in operating expenses obscures both profit and cash implications.
🧾 Debt changes both liquidity and earnings
Borrowing brings in cash, but it also creates a liability, principal repayment requirements, and interest expense. A debt schedule tracks the opening balance, new borrowings, repayments, interest, and closing balance for each period.
Interest may depend on the average or opening debt balance, the loan rate, and the specific terms of the agreement. Revolving facilities can add complexity because borrowing may rise and fall with cash needs.
Debt can support investment or bridge seasonal cash swings, but it should not be treated as revenue. A model that relies on new borrowing to cover recurring operating losses should make that dependency visible.
🔗 The three statements must connect
The integrated financial model connects the income statement, balance sheet, and cash flow statement. This is one of the most valuable disciplines in financial modeling because it exposes incomplete logic.
- Net income from the income statement contributes to retained earnings on the balance sheet.
- Depreciation affects profit and accumulated depreciation, while being added back in operating cash flow.
- Changes in receivables, inventory, and payables affect both balance-sheet balances and operating cash flow.
- Capex affects cash, fixed assets, and later depreciation expense.
- Debt movements affect cash, liabilities, and interest expense.
When these links work, the balance sheet balances: total assets equal total liabilities plus equity. If it does not, a formula, sign, timing assumption, or missing line needs investigation.
🧪 Scenario analysis tests alternative futures
A base case is only one coherent set of assumptions. Scenario analysis builds other coherent versions, such as an upside case with stronger conversion and a downside case with slower collections and weaker demand.
A good scenario changes linked assumptions together. For instance, a downturn might reduce units sold, increase churn, delay customer payments, and postpone hiring. Changing revenue alone may understate the resulting cash pressure.
Scenarios are not predictions or promises. They are structured questions: What would this business look like if this set of conditions occurred?
🎚️ Sensitivity analysis finds the critical levers
Sensitivity analysis changes one key assumption, or sometimes two, while holding others constant. It reveals which variables have the largest effect on an output such as cash balance, operating profit, or valuation.
For a retailer, gross margin and inventory turns may be highly influential. For a subscription company, churn and customer acquisition cost may dominate. For a construction contractor, project timing and collection delays may matter more than a modest change in overhead.
The output should lead to action. If small changes in customer payment time create a cash deficit, collections management and credit policy deserve more attention than minor savings in office supplies.
🚨 Circular references require deliberate handling
A circular reference occurs when a formula depends, directly or indirectly, on itself. Interest expense can create a common example: interest depends on debt, but debt may depend on the cash shortfall, which depends on interest expense.
Some modeling tools can solve circular calculations through iterative settings, but relying on iteration can make a model harder to audit. Another approach is to calculate interest using opening debt, average debt based on a prior estimate, or a simplified cash sweep.
There is no single correct technique for every model. The appropriate choice depends on materiality, required precision, and whether reviewers can understand and validate the method.
🧹 Model design should make review easier
Clear architecture reduces errors. A practical workbook often separates assumptions, operating schedules, supporting schedules, financial statements, and dashboard outputs. Consistent time columns and labels make movement through the model easier.
Use formulas that are readable enough to inspect. Avoid unexplained constants embedded in long formulas. Keep units clear: dollars versus thousands, percentages versus decimal rates, and monthly figures versus annual figures.
Formatting is not proof of correctness, but it can communicate structure. Many teams use consistent conventions for input cells, formulas, and links; the exact colors matter less than applying the convention consistently.
✅ Checks are the model’s internal controls
A model needs checks just as an accounting process needs reconciliations. Checks should be visible and designed to fail clearly when a relationship breaks.
- Balance-sheet check: assets less liabilities and equity equals zero.
- Cash check: ending cash equals beginning cash plus the net change in cash.
- Roll-forward check: opening balance plus additions less reductions equals closing balance.
- Sign check: cash outflows and expenses follow the model’s stated sign convention.
- Reasonableness check: margins, headcount, and key ratios remain plausible relative to assumptions.
A zero check is reassuring, but it does not prove every assumption is sensible. Mechanical integrity and business realism are separate tests.
🔍 Historical data anchors the starting point
Forecasts should usually begin with a clean historical baseline. Actual financial statements, management reports, payroll records, sales data, and operational metrics can reveal current run rates and seasonal patterns.
Historical results are not a substitute for judgment. A one-time contract, unusual supplier disruption, acquisition, or accounting reclassification can distort a trend. The modeler needs to understand what happened before extending it forward.
Reconcile historical inputs to reliable records where possible. If the base period is wrong, a sophisticated forecast can carry that error into every future period.
🌦️ Seasonality changes the shape of cash needs
Annual totals can conceal difficult months. A business may generate most revenue during a holiday season but pay inventory suppliers months earlier. Another may collect annual customer renewals in one quarter while incurring payroll evenly throughout the year.
Monthly forecasting reveals these timing gaps. It can show whether a line of credit is needed, when inventory should be purchased, or whether a hiring plan creates a temporary cash trough.
Seasonality assumptions should be based on observed patterns when available, adjusted cautiously for known operational changes. Copying last year’s monthly percentages without understanding why they occurred can reproduce a one-off event.
🧯 Common shortcuts weaken a forecast
Several habits create models that appear complete but fail under review:
- Starting with a desired profit figure and backing into unexplained revenue.
- Forecasting revenue without checking capacity, staffing, inventory, or pipeline.
- Using annual profit while ignoring monthly cash timing.
- Hardcoding totals in statements instead of linking support schedules.
- Applying a single growth rate to every customer, product, and cost category.
- Presenting a base case as though it were certain.
These shortcuts save time at first but make revision difficult. They also prevent decision-makers from seeing what must be true for the forecast to work.
🗣️ A forecast needs owners and explanations
Finance may build the model, but finance should not invent every operating assumption. Sales leaders can explain pipeline conversion and pricing; operations teams understand capacity; procurement understands supplier terms; HR understands hiring timing.
Assign an owner to material assumptions and record the source or rationale. “Management estimate” can be acceptable if it is labeled as such, but it is more useful to state what the estimate represents and what could cause it to change.
This process improves accountability without turning the model into a blame tool. The objective is to learn quickly when actual results diverge from the plan.
🔄 Forecasting is a recurring management process
A forecast loses value when it is built once and left untouched. Actual results should be compared with forecast results, and the variance should be explained by drivers: volume, price, mix, labor efficiency, collection timing, or other relevant factors.
A rolling forecast extends the planning horizon as each period closes. It separates the closed actual past from the estimated future, allowing decision-makers to update plans without rewriting history.
Frequent updates are not always better. The cadence should match the speed and volatility of the business. What matters is that material changes are incorporated before decisions are made on outdated assumptions.
🧠 The core principle: traceable assumptions create useful forecasts
The most trustworthy model is not the one with the most tabs or the most elaborate formulas. It is the one where a reader can trace a forecast result back through schedules to understandable business assumptions.
That traceability creates discipline. Revenue must come from customers, units, prices, and timing. Profit must reflect delivery and operating costs. Cash must reflect collections, payments, investment, and financing. The balance sheet must absorb the consequences.
When those links are explicit, a financial model becomes a practical engineering tool for business decisions: change an input, observe the connected system, test the risk, and decide with clearer evidence.
A financial forecast becomes credible when its numbers are the visible consequence of a coherent operating plan—not a set of hoped-for totals. 💰📊🔍