
A business can show a profit on paper and still struggle to pay suppliers on Friday. That gap surprises many new managers, investors, and students because profit measures performance over a period, while bills require cash at particular moments.
Imagine a retailer that has plenty of goods on its shelves, customers who will pay next month, and payroll due this week. It may be economically healthy, yet temporarily short of spendable funds. This is a working-capital problem.
Working capital, the current ratio, and the quick ratio are practical tools for examining that short-term position. They turn a balance sheet into questions that matter: Can the business meet obligations due soon? How much margin does it have? Is that apparent safety tied up in inventory?
These calculations are simple, but their interpretation is not automatic. The right conclusion depends on the business model, the quality of the underlying assets, payment timing, and the industry.
🧭 Start With the Short-Term Financial Picture
These measures focus on items expected to be converted into cash, used, or paid within roughly one operating cycle or one year, depending on the reporting framework and circumstances. They are therefore often called liquidity measures.
Liquidity is the ability to meet near-term obligations without disrupting normal operations. It is not the same as long-term solvency, which concerns whether a business can survive and repay debts over many years.
A company could own valuable buildings and equipment but still have weak liquidity if it cannot readily turn those assets into cash. Conversely, a firm can have modest fixed assets and strong liquidity if cash arrives quickly and suppliers provide flexible payment terms.
📒 Read the Balance Sheet Before Using Any Formula
The balance sheet organizes resources and claims at a point in time. For liquidity analysis, locate the current asset and current liability sections rather than looking first at revenue or net income on the income statement.
Current assets commonly include cash, short-term investments, accounts receivable, inventory, and prepaid expenses. Current liabilities commonly include accounts payable, accrued expenses, short-term borrowings, taxes payable, and the current portion of long-term debt.
Labels differ across companies and accounting systems. Always read the line items and notes when available. A ratio is only as meaningful as the classifications and values used to calculate it.
💼 Define Current Assets Clearly
Current assets are expected to become cash, be sold, or be consumed soon. Cash is already available; accounts receivable represent customer balances expected to be collected; inventory represents goods intended for sale or production.
Not all current assets are equally liquid. A bank balance can pay a bill immediately. Inventory may require marketing, a sale, delivery, and collection from the customer before it produces cash.
Prepaid insurance and prepaid rent count as current assets because they provide future economic benefit. However, they usually cannot be used to pay creditors, which becomes especially relevant when calculating the quick ratio.
🧾 Define Current Liabilities Carefully
Current liabilities are obligations expected to be settled soon. Accounts payable are amounts owed to suppliers, while accrued expenses are costs already incurred but not yet paid, such as wages or utilities.
Short-term loans, overdrafts, tax obligations, and the portion of a long-term loan due within the next year can also appear here. Their timing matters: an obligation due next week creates more pressure than one due in eleven months.
Companies sometimes have seasonal borrowing or large annual payments. A single balance-sheet date may therefore present an unusually strong or weak picture. This is one reason analysts often compare several reporting periods.
➖ Calculate Working Capital
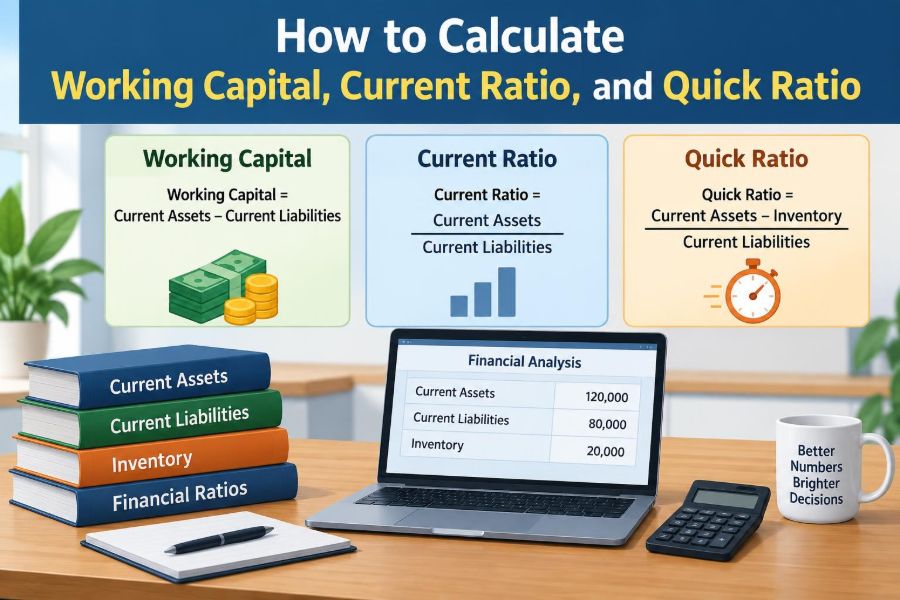
Working capital = Current assets − Current liabilities. The result is a currency amount, not a percentage or multiple.
Suppose a hypothetical business reports current assets of $240,000 and current liabilities of $150,000. Its working capital is $90,000:
Working capital = $240,000 − $150,000 = $90,000
This positive amount suggests that current assets exceed current liabilities. It does not prove that every upcoming payment can be made on time, but it provides an initial indication of short-term financial capacity.
✅ Understand Positive Working Capital
Positive working capital means current assets are greater than current liabilities. In broad terms, the company has a short-term asset cushion after covering short-term obligations.
That cushion can support routine purchases, payroll, tax payments, and unexpected delays in customer collections. It may also reduce the need to borrow at short notice.
However, the composition matters. A positive result dominated by slow-moving or obsolete inventory is less reassuring than the same amount concentrated in cash and reliable receivables.
⚠️ Interpret Negative Working Capital Without Panic
Negative working capital means current liabilities exceed current assets. It can signal a genuine liquidity risk, especially when bills are due quickly and the company has limited financing options.
Yet negative working capital is not automatically a failure. Some businesses collect cash from customers before paying suppliers. Grocery retailers, subscription businesses, and companies selling prepaid services may operate effectively with this pattern.
The key question is whether incoming cash is dependable and arrives before obligations fall due. Negative working capital caused by a disciplined, repeatable cash cycle differs sharply from negative working capital caused by overdue receivables and shrinking sales.
🔢 Calculate the Current Ratio
The current ratio = Current assets ÷ Current liabilities. Unlike working capital, it is expressed as a multiple.
Using the earlier hypothetical figures:
Current ratio = $240,000 ÷ $150,000 = 1.60
A current ratio of 1.60 means the business has $1.60 of current assets for each $1.00 of current liabilities. This normalizes the comparison, making it easier to compare businesses of different sizes than a working-capital dollar amount alone.
📏 What a Current Ratio Tells You
A ratio above 1.00 means current assets exceed current liabilities at the reporting date. A ratio below 1.00 means current liabilities exceed current assets.
There is no universally “good” current ratio. A manufacturer with long production cycles may need a larger cushion than a high-volume retailer that sells inventory daily and negotiates long supplier payment terms.
A very high ratio also deserves investigation. It might reflect prudent reserves, but it can also indicate cash sitting idle, excessive inventory, or customers taking too long to pay.
⚡ Calculate the Quick Ratio
The quick ratio is a stricter liquidity measure because it excludes current assets that may not become cash quickly enough. A common formula is:
Quick ratio = (Cash + Short-term investments + Accounts receivable) ÷ Current liabilities
Another common approach begins with total current assets and subtracts inventory and prepaid expenses. Both approaches can be reasonable when the underlying classifications are clear, but consistency is essential when comparing periods or companies.
🚀 Why the Quick Ratio Is Called the Acid-Test Ratio
The quick ratio is also known as the acid-test ratio. Its purpose is to ask whether the business can cover current liabilities using its most liquid or “quick” assets, without relying on inventory sales.
Inventory is excluded because its conversion to cash may be uncertain. It can be seasonal, specialized, damaged, outdated, or subject to discounting. Prepaid expenses are excluded because they generally cannot be collected in cash.
The test is useful when inventory represents a large share of current assets or when inventory values may be difficult to realize.
🧮 Work Through One Complete Example
Consider a hypothetical company with cash of $30,000, short-term investments of $10,000, accounts receivable of $60,000, inventory of $90,000, and prepaid expenses of $10,000. Its current liabilities total $100,000.
| Measure | Calculation | Result |
|---|---|---|
| Working capital | $200,000 − $100,000 | $100,000 |
| Current ratio | $200,000 ÷ $100,000 | 2.00 |
| Quick ratio | ($30,000 + $10,000 + $60,000) ÷ $100,000 | 1.00 |
The current ratio looks comfortable because it includes inventory and prepaid expenses. The quick ratio shows that the business has exactly $1.00 of quick assets per $1.00 of current liabilities. That distinction should prompt a closer look at receivable collection and cash timing.
🔍 Compare the Current Ratio and Quick Ratio
The gap between the two ratios is informative. A small gap means inventory and prepayments make up a relatively small portion of current assets. A large gap means the apparent liquidity depends more heavily on assets that are less immediately available.
Neither result is automatically good or bad. A supermarket may turn inventory into cash so rapidly that excluding it can understate operating liquidity. A machinery distributor holding specialized stock may face a much greater risk if sales slow.
Use the current ratio for a broad short-term view and the quick ratio to stress-test that view.
🏭 Match the Ratio to the Industry
Industry context shapes interpretation. A consulting firm typically has little inventory, so its current and quick ratios may be close together. A wholesaler may hold substantial inventory, causing a wider spread.
Businesses with stable daily cash sales can sometimes function with lower ratios than project-based firms that wait months for customer payments. Companies with seasonal demand may build inventory before peak selling periods and show temporarily weaker ratios.
Compare a company primarily with its own prior periods and with businesses that have similar operating models. Comparing unrelated industries can create misleading conclusions.
📦 Examine Inventory Quality, Not Just Its Balance
Inventory is usually recorded at a cost-based accounting amount, subject to applicable accounting rules. That recorded amount may differ from what the business can quickly recover through a sale.
Ask whether the inventory is fast-moving, perishable, seasonal, obsolete, or highly specialized. A large balance of popular standard products may be a valuable operating asset; an equally large balance of outdated parts may provide little short-term protection.
Inventory turnover, sales trends, markdowns, and write-downs can add useful context. The current ratio does not reveal these quality differences by itself.
💳 Test Whether Receivables Are Collectible
Accounts receivable are usually included in quick assets, but they are not cash. A customer may pay late, dispute an invoice, experience financial distress, or default.
Review the age of receivables where information is available. Balances outstanding well beyond normal credit terms deserve more scrutiny than recently issued invoices to reliable customers.
A rising quick ratio can look positive while concealment may occur in a growing receivable balance. If receivables grow much faster than sales, investigate collection practices and credit quality before treating them as fully liquid.
🗓️ Timing Can Matter More Than the Total
Ratios summarize balances on one date, but liquidity is ultimately a timing issue. A company may have enough total current assets and still miss a payment if cash collections arrive after payroll, loan, or supplier due dates.
A short-term cash forecast lists expected inflows and outflows by week or month. It can reveal a pinch point that the current ratio cannot show.
For management, ratios are best paired with a rolling cash forecast. For external readers, cash flow statements and disclosures can provide clues about whether operating cash generation supports the balance-sheet picture.
🔄 Connect the Measures to the Operating Cycle
The operating cycle traces the path from paying for inputs to collecting cash from customers. A typical sequence is purchasing inventory, selling it, invoicing the customer, and collecting the receivable.
A shorter cycle generally reduces the amount of capital tied up in daily operations. Faster inventory turnover and faster receivable collection can improve liquidity without requiring the business to raise new money.
Supplier credit affects the other side of the cycle. Longer payment terms can preserve cash temporarily, but stretching payments beyond agreed terms can damage supplier relationships and create operational risk.
🧰 Use Working Capital as a Management Tool
Managers use working capital to make operating decisions, not merely to prepare reports. They may set inventory targets, adjust customer credit terms, schedule purchases, negotiate payment dates, or arrange a line of credit before a busy season.
A business with growing sales often needs more working capital because it must fund additional stock and receivables before collecting from customers. Growth can therefore consume cash even when profit is increasing.
Tracking the components separately helps identify the cause. “Working capital worsened” is less actionable than “inventory increased while receivable collection slowed.”
📈 See Why Growth Can Create a Cash Strain
Suppose a small contractor wins several new projects. It buys materials and pays workers now, but contract terms allow customers to pay after milestones are approved. Revenue and profit may rise, while cash becomes tighter.
This does not mean the new work is unprofitable. It means the business must finance the time between spending and collection.
Before expanding, management should estimate the additional inventory, labor, receivables, deposits, and financing required. Working-capital planning turns a promising sales forecast into a more realistic cash plan.
🪙 Recognize the Limits of Cash Alone
Cash is the most liquid current asset, but a large cash balance does not settle every analytical question. Some cash may be restricted for a specific purpose, held in another jurisdiction, or needed for near-term commitments not obvious from the ratio.
Likewise, a company with modest cash may be financially flexible if it collects rapidly, has dependable operating cash flow, and has unused committed borrowing capacity. Financing access should not be assumed without evidence, however.
Ratios describe a balance-sheet snapshot rather than every resource and constraint affecting liquidity.
🧱 Avoid Treating a Ratio Benchmark as a Rule
You may hear that a current ratio of 2.00 or a quick ratio of 1.00 is desirable. Such rules of thumb can be useful starting points for classroom exercises, but they are not universal thresholds.
A ratio that looks low may suit a cash-generative retailer. A ratio that looks high may be necessary for a company facing volatile demand, slow-paying customers, or large seasonal purchases.
Rather than declaring a number good or bad, ask what changed, why it changed, and whether the business can meet obligations when due.
🚫 Avoid Common Calculation Errors
Small classification mistakes can materially distort liquidity measures. Check the reporting date, units, and included accounts before pressing the calculator button.
- Do not divide by total liabilities; use current liabilities.
- Do not use total assets in the current ratio; use current assets.
- Do not include inventory in a quick ratio unless a clearly stated, justified method calls for it.
- Do not forget prepaid expenses when deriving quick assets from total current assets.
- Do not mix figures from different dates or statements.
- Do not confuse a ratio of 1.50 with 150%; either expression may be used, but label it correctly.
🧾 Keep Formula Variations Consistent
Working capital and the current ratio have straightforward standard forms. The quick ratio has more presentation variation because companies may classify marketable securities, restricted cash, or certain receivables differently.
State the formula you used. For example, “quick assets divided by current liabilities” is clearer when you also identify quick assets as cash, short-term investments, and net accounts receivable.
When comparing firms, read their financial statement captions and apply a consistent method where possible. Blindly copying a reported ratio can mask different underlying definitions.
📊 Analyze the Trend, Not Just One Date
A single ratio can be affected by an end-of-period collection, a planned inventory purchase, or a temporary debt repayment. A trend over several months, quarters, or years is often more revealing.
For example, a current ratio declining from period to period may indicate rising short-term funding pressure. It could also reflect intentional efficiency improvements, so the components and cash flows still need review.
Look for direction, volatility, and explanations. Stable ratios are not automatically healthy, and changing ratios are not automatically troubling.
🔗 Pair Liquidity Ratios With Cash Flow Information
The statement of cash flows shows how cash changed through operating, investing, and financing activities. It can help distinguish profits supported by cash collections from profits tied up in receivables or inventory.
Operating cash flow is particularly relevant, although one period is not conclusive. Companies may experience legitimate temporary changes in working capital because of seasonality or a planned expansion.
Used together, the balance sheet, income statement, cash flow statement, and management context provide a more complete assessment than any ratio alone.
🏦 Consider Lender and Supplier Perspectives
Lenders may examine liquidity ratios when assessing the risk that a borrower can meet near-term obligations. They may also consider cash flow, collateral, debt terms, and the reliability of the business’s forecasts.
Suppliers make similar practical judgments when deciding on credit terms or order limits. A business that pays consistently on time can earn trust even if a simple ratio appears modest.
For the business, maintaining transparent records and monitoring upcoming commitments can improve conversations with banks and suppliers before pressure becomes urgent.
🛠️ Improve Working Capital Thoughtfully
Improvement is not simply about making a ratio larger. It means releasing unnecessary cash tied up in operations while protecting sales, service, and supplier relationships.
- Invoice promptly and follow up on overdue customer balances.
- Set credit limits and payment terms appropriate to customer risk.
- Use demand forecasts to reduce excess stock without causing stockouts.
- Review slow-moving inventory and consider controlled clearance or purchasing changes.
- Negotiate realistic supplier terms rather than paying earlier than necessary.
- Prepare cash forecasts before seasonal peaks, expansions, or major payments.
Each action has trade-offs. Tighter customer terms may reduce sales, lower inventory may reduce availability, and delayed supplier payments may harm relationships. The goal is balance, not maximization of a single metric.
🧑🎓 Solve Classroom and Workplace Problems Systematically
When given a set of financial data, begin by sorting every item into current assets, noncurrent assets, current liabilities, or noncurrent liabilities. Do not assume an item belongs in a formula because its name sounds familiar.
- Add qualifying current assets.
- Add qualifying current liabilities.
- Subtract liabilities from assets to find working capital.
- Divide current assets by current liabilities to find the current ratio.
- Identify cash, qualifying short-term investments, and receivables—or subtract inventory and prepayments consistently—to find quick assets.
- Divide quick assets by current liabilities and interpret the results in context.
Show the formula, substitute the numbers, include units, and round sensibly. Clear working makes an error easier to find and lets another person understand your assumptions.
🧠 Build a Better Interpretation From Three Questions
After calculating the measures, ask three practical questions. First, what makes up the current assets? Cash and reliable receivables generally provide a different level of comfort than old inventory.
Second, when do cash inflows and payments occur? A healthy total can hide a near-term timing mismatch. Third, how does this result compare? Review the company’s own history, its operating model, and comparable firms.
Those questions transform ratios from mechanical arithmetic into useful financial analysis.
🎯 Bring the Core Principle Together
Working capital measures the dollar difference between short-term resources and short-term obligations. The current ratio compares all current assets with current liabilities. The quick ratio applies a stricter test by focusing on assets that are generally more readily converted into cash.
None of these measures should be read in isolation. Inventory quality, collectibility of receivables, due dates, seasonality, financing arrangements, and the operating cycle all influence what the numbers mean.
The strongest analysis combines accurate calculation with informed judgment. A ratio is a starting point for a conversation about cash, not a final verdict on a business.
Calculate the measures carefully, then look beneath them: sustainable liquidity depends on the timing and quality of cash inflows, not merely on a favorable-looking balance-sheet number. 💰📊🧭