
It is late in the month, and a finance team is preparing a management report. One analyst is updating actuals from the general ledger, another is revising sales assumptions in a spreadsheet, and a manager is asking why the cash forecast has changed since last week.
None of these tasks is unusual. The problem is that a change in one file can take hours to find, validate, and carry through every budget, dashboard, and board-reporting pack that depends on it.
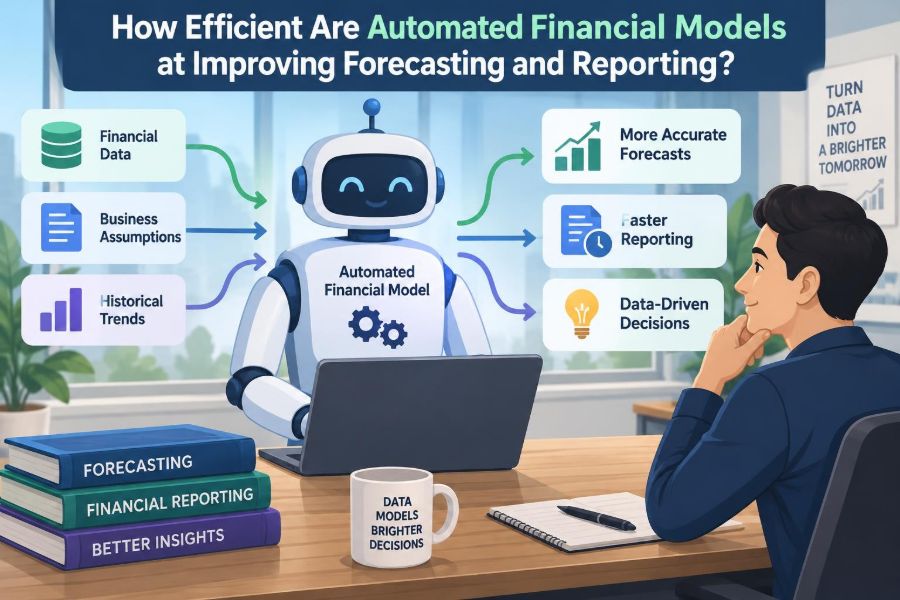
Automated financial models promise a better process: less copying, faster refreshes, and forecasts that respond to new information. But speed alone does not make a model useful. A fast process can distribute an incorrect assumption just as efficiently as a correct one.
The real question is not whether automation is good. It is where automation improves financial judgment, where it creates new risks, and how teams can measure its value.
🧭 What an automated financial model actually is
An automated financial model is a structured set of calculations that receives data, applies predefined logic, and produces outputs with limited manual intervention. Its inputs may include accounting-system balances, operational metrics, payroll records, customer data, or manually approved assumptions.
The model may live in a well-designed spreadsheet, a planning platform, a database, or a combination of tools. Automation is not defined by the software; it is defined by whether repeatable work—loading data, mapping accounts, calculating results, and producing reports—happens consistently without rekeying each period.
🎯 Why forecasting and reporting are different jobs
Financial reporting explains what has happened. It organizes actual transactions into reliable statements, variance reports, and performance commentary. Forecasting estimates what may happen next using actual results, drivers, assumptions, and scenarios.
Automation can support both, but their controls differ. Reporting needs strong reconciliation to recorded results. Forecasting needs transparent assumptions and a way to revise estimates when conditions change. Confusing these purposes can produce a forecast that looks precise merely because it resembles a financial statement.
⚙️ Where efficiency comes from
The largest efficiency gain usually comes from removing repeated handoffs. Rather than downloading a trial balance, pasting it into a workbook, adjusting labels, and rebuilding charts, a controlled process can import, validate, map, and publish the same data path each close.
That changes the team’s use of time. Analysts can spend less effort assembling a number and more effort asking whether the number is plausible, what caused the variance, and which decision should follow.
🧮 The basic forecasting engine
Most financial models combine historical actuals with assumptions about future drivers. Revenue might be driven by units sold and price; payroll by headcount, salary rates, and hiring dates; cost of goods sold by volume and supplier pricing.
A useful simplified relationship is Revenue = Volume × Average Price. This does not capture every business reality, but it makes the forecast explainable. When revenue moves, users can identify whether volume, price, timing, or another stated assumption caused it.
🔗 Reliable data connections reduce rekeying
Direct connections or scheduled data imports can reduce transcription errors and shorten reporting cycles. They are especially valuable when the same source data feeds several reports, such as a profit-and-loss statement, cash forecast, and department dashboard.
However, a connection is not automatically trustworthy. Source-system fields can change, transactions can be posted late, and account structures can be revised. The model needs checks that reveal whether an import is complete and whether totals agree to the source.
🗂️ Account mapping is an overlooked control
Accounting data is often recorded at more detail than management reporting requires. Mapping converts source accounts, cost centers, products, or entities into consistent reporting categories such as payroll, marketing, or subscription revenue.
A mapping table is preferable to scattered hard-coded formulas. It creates one visible place to review classifications, makes changes auditable, and prevents the same account from being treated differently across reports.
🔄 Refreshing data is not the same as validating it
A refresh answers, “Did the model receive new data?” Validation answers, “Does the new data make sense and reconcile?” Both questions matter.
Useful automated checks include comparing loaded totals to a control total from the source, flagging unmapped accounts, identifying duplicate records, and highlighting periods with unexpectedly missing data. A model should stop or visibly warn users when a critical check fails rather than quietly producing polished outputs.
📅 Faster close cycles improve decision timing
When reporting is assembled manually, managers may receive a completed view after much of the next period has passed. Automation can compress routine preparation and make the report relevant while decisions can still influence the outcome.
This is an operational benefit, not merely an accounting convenience. A manager who sees an emerging expense overrun early may adjust hiring, purchasing, or project scope. A late but flawless report can be less useful than a timely, clearly labeled preliminary one.
📈 Driver-based models make forecasts easier to explain
Driver-based forecasting starts with activities that cause financial results instead of projecting every account as a percentage of last year. For example, a retailer may forecast store traffic, conversion rate, average basket value, and gross margin.
This approach is often more efficient to update because a small set of operating assumptions flows through many outputs. It also encourages finance and operating teams to discuss business mechanics rather than negotiate unexplained top-line numbers.
🧱 Not every expense should use the same method
Different costs behave differently. Rent may be fixed by contract, sales commissions may vary with revenue, and cloud-service costs may change in steps as usage reaches a threshold. A single “increase all expenses by 3%” rule may be quick but can obscure material risks.
Model design should match materiality. Automate detailed logic where it changes decisions; use simpler methods where extra complexity offers little improvement. Efficiency means applying effort proportionately, not modeling every minor account with equal sophistication.
🌦️ Scenario planning turns uncertainty into choices
A single forecast is usually a point estimate, not a promise. Automated models can quickly produce base, upside, and downside scenarios by changing a controlled set of assumptions.
For a hypothetical manufacturer, the downside case might combine lower order volume, delayed customer collections, and higher input costs. The value is not predicting exactly which event will occur. It is showing how cash, profit, and covenant headroom could respond if conditions move together.
🎚️ Sensitivity analysis reveals the biggest levers
Sensitivity analysis changes one assumption at a time to observe the effect on an output. A finance team might test how a change in gross margin, customer churn, or collection days affects operating profit or closing cash.
This is particularly useful when leaders disagree about assumptions. Instead of debating whether one estimate is “right,” the model can show the consequence if it is wrong. The discussion then focuses on the variables worth monitoring most closely.
💵 Cash forecasting needs more than profit
Profit forecasts and cash forecasts are related but not interchangeable. Revenue may be recognized before customers pay, and an expense may affect cash before or after it affects the income statement.
An automated cash model should explicitly consider receivables, payables, inventory, payroll timing, tax payments, debt service, capital expenditure, and financing flows where relevant. Otherwise, a business can appear profitable in the forecast while facing a near-term liquidity pressure.
🧾 Automated reporting improves consistency
Standardized report templates can ensure that departments see consistent period labels, variance calculations, definitions, and visual conventions. This reduces disputes caused by two teams using different versions of “actual,” “budget,” or “year to date.”
Consistency also supports governance. When a board pack, operating dashboard, and departmental report draw from the same approved model logic, reviewers can trace differences to purpose or timing instead of wondering which spreadsheet is correct.
🔍 Traceability matters when numbers are challenged
A good model lets a reviewer move from an output to its calculation, its assumptions, and its source data. This trail is often called lineage or traceability. It is essential when results influence resource allocation, external communication, or compliance decisions.
Automation can improve traceability when it records refresh times, data versions, mappings, and approved assumptions. It can reduce traceability when complex scripts or opaque formulas are understood by only one person. Documentation is therefore part of the model, not an optional appendix.
🛡️ Controls must be designed into the workflow
Automated models need preventive controls, such as restricted access to key assumptions, and detective controls, such as reconciliation reports and variance alerts. A control should have an owner, an expected result, and a defined response when it fails.
- Separate raw imported data from calculations and final reporting outputs.
- Require approval for material assumption changes.
- Lock formula areas while allowing controlled input cells.
- Retain version history for significant forecast cycles.
- Reconcile reported actuals to the general ledger or approved source.
👥 Human review remains essential
Automation is strong at repetition and arithmetic. It is weaker at recognizing a new commercial arrangement, a one-time legal settlement, a changed accounting policy, or a sales forecast shaped by an unrecorded customer conversation.
Reviewers provide context. Their role should shift from manually proving every addition to investigating exceptions, challenging assumptions, and deciding whether unusual results represent an error, a timing difference, or a real signal.
🚨 Garbage in, garbage out still applies
Bad master data, inconsistent customer identifiers, incomplete cost-center coding, and late journal entries can all damage automated outputs. Because automation runs quickly, it can make a data-quality issue visible across every report before anyone has noticed the root cause.
The solution is not to abandon automation. It is to establish data ownership and clear definitions. If “active customer” has different meanings in sales, operations, and finance, no forecasting tool can resolve that disagreement by itself.
🧠 False precision is a forecasting hazard
A model may calculate to many decimal places, but its assumptions may still be uncertain. Forecasts should not imply a degree of certainty that the business cannot support.
Use sensible rounding, ranges where appropriate, and commentary about key dependencies. A forecast of cash should communicate whether it relies on a major collection arriving on time; displaying an exact currency figure does not remove that uncertainty.
📊 Dashboards should answer decisions, not display everything
Automation makes it easy to create many charts. That does not make a dashboard effective. A useful dashboard concentrates on metrics tied to decisions, such as revenue drivers, margin movement, cash conversion, working-capital trends, and material forecast variance.
Each visual should have a clear definition and period basis. Too many indicators can hide the issue that needs attention. A compact dashboard with a short exception list is often more actionable than a dense page of perfectly refreshed charts.
🧪 Testing protects models from silent failure
Financial model testing includes more than checking whether formulas return values. Teams should test normal periods, zero activity, unusual transactions, new accounts, changed entity structures, and deliberately incorrect inputs that ought to trigger controls.
Regression testing is helpful after a change: compare key outputs before and after an update, then explain every material difference. This is especially important when models contain automated scripts, complex allocations, or multiple connected systems.
🏗️ Spreadsheets can be automated responsibly
Spreadsheets remain practical for many teams because they are flexible and familiar. They become fragile when multiple uncontrolled copies circulate, formulas are overwritten, or critical logic is embedded in hidden cells.
A responsible spreadsheet model uses clear input areas, protected formulas, consistent naming, documented logic, and a defined close process. For recurring, high-volume, or multi-user processes, a database or planning system may eventually offer stronger workflow and access controls.
🧩 Tool choice should follow process complexity
There is no universally best tool. The appropriate choice depends on data volume, number of entities, forecast frequency, required audit trail, available technical skills, and the cost of error or delay.
| Situation | Often suitable approach | Primary concern |
|---|---|---|
| Small recurring forecast with stable data | Controlled spreadsheet with refresh tools | Version discipline and review |
| Multiple departments and frequent revisions | Planning platform or central model | Workflow and assumption governance |
| Large transaction volumes or many sources | Database-backed data pipeline and reporting layer | Data quality and technical monitoring |
📏 Measure efficiency beyond hours saved
Time saved is a valid measure, but it is incomplete. A model may reduce preparation time while creating more review work or producing outputs that managers do not use.
Consider a balanced set of measures: reporting-cycle time, number of manual touchpoints, reconciliation exceptions, forecast-error patterns, time spent on analysis, and stakeholder confidence in definitions. The aim is not simply faster production; it is better-supported decisions with a sustainable workload.
🎯 Forecast accuracy needs careful interpretation
Forecast accuracy compares an estimate with a later actual outcome. It is useful, but it should be interpreted by horizon and circumstance. A forecast made twelve months ahead should not be judged by the same standard as one made after most of the month has elapsed.
Look for bias as well as error. Repeatedly optimistic revenue assumptions or routinely understated costs may reveal incentives, weak drivers, or missing feedback. The goal is learning: improve the process without treating every forecast miss as individual failure.
🗓️ A practical implementation sequence
Teams often fail by attempting to automate every report at once. Begin with a recurring process that has clear pain points, stable source data, and a meaningful audience. Establish a reliable baseline before expanding scope.
- Map the current process, sources, owners, and manual handoffs.
- Define outputs, key decisions, and non-negotiable controls.
- Standardize data definitions and account mappings.
- Automate one data flow and build visible reconciliation checks.
- Test with historical periods and parallel-run against the existing process.
- Train users, document ownership, and review performance after each cycle.
🧑💼 Finance skills shift from preparation to interpretation
Automation does not eliminate the need for finance professionals. It changes the highest-value work. Accounting knowledge remains necessary to interpret transactions correctly, while data literacy helps teams understand flows, transformations, and control failures.
Strong practitioners can translate between operations, systems, and financial outcomes. They ask why a metric changed, whether the underlying data supports the conclusion, and what action is appropriate—not merely whether a workbook recalculated.
⚖️ When automation is not the right immediate answer
Some processes are too new, too irregular, or too poorly defined to automate effectively. If assumptions change every week and no one agrees on the required report, automating the current confusion may harden a bad process.
In those cases, simplify and standardize first. Manual work can be appropriate for rare, judgment-heavy analyses, provided it is reviewed carefully. Automation earns its cost when a process is repeatable enough to benefit from dependable rules.
🧭 The core principle: automate repeatability, preserve judgment
Automated financial models are efficient when they reduce low-value repetition while making data, assumptions, and exceptions easier to inspect. Their strongest contribution is not that they predict the future flawlessly; it is that they shorten the path from new information to an informed conversation.
Reliable forecasting and reporting require a partnership between systems and people. Systems provide speed, consistency, and scale. People provide skepticism, commercial context, ethical responsibility, and accountability for decisions.
The most effective automated model is not the one with the most features; it is the one that delivers timely, traceable information and leaves people free to apply informed judgment. Build that balance, and automation becomes a durable part of better financial management. 📊💡