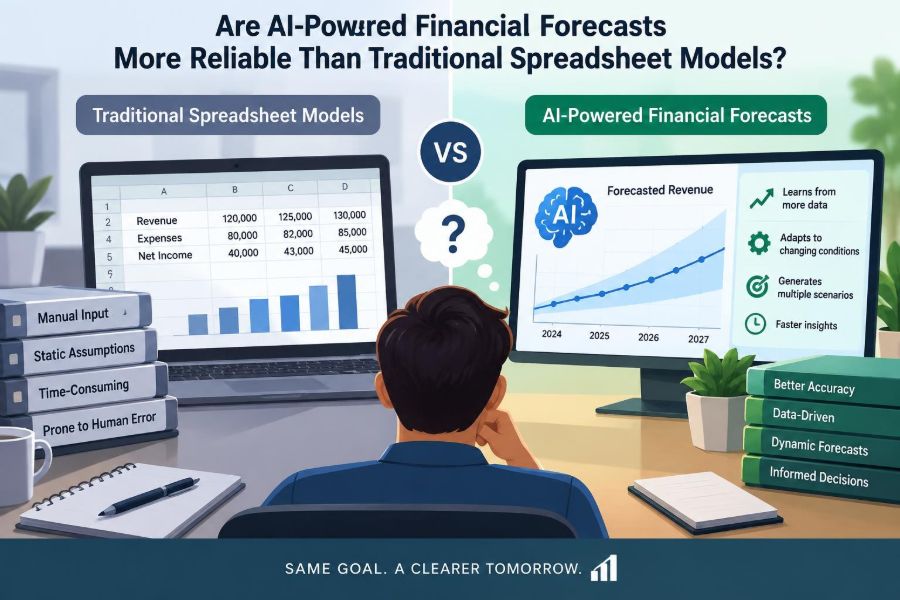

It is Monday morning, and a finance team is preparing its monthly forecast. One analyst has updated a carefully built spreadsheet with revised sales assumptions. Another has opened an AI forecasting tool that has already processed transaction history, pipeline data, and recent customer behavior.
Both outputs look precise. Both contain charts, totals, and confident-looking numbers. Yet neither answer is automatically reliable simply because it was calculated quickly—or because it took hours to build.
Forecasts influence hiring, inventory, borrowing, pricing, capital investment, and cash planning. A weak forecast can cause a business to buy too much stock, miss a funding need, or set targets that disconnect managers from operational reality.
The useful question is not whether AI should replace spreadsheets. It is which method is trustworthy for a particular decision, given the available data, the uncertainty involved, and the need to explain the result.
🔎 Reliability Means More Than a Close Number
A reliable forecast is not merely one that happens to land near the final result. It should be based on sound inputs, behave sensibly when conditions change, communicate uncertainty, and be understandable enough to challenge.
Forecast quality also depends on the decision being supported. A weekly cash forecast may need timely detail more than long-range precision, while a three-year investment plan may need transparent assumptions and scenarios.
📊 What Traditional Spreadsheet Models Do Well
Traditional models translate a business story into formulas. Revenue might equal expected units multiplied by price, while payroll might reflect approved headcount, start dates, bonuses, and employer costs.
This structure makes the logic visible. A reviewer can trace a forecast from a summary dashboard back to an assumption, a calculation, and often a source file. That audit trail is a major reason spreadsheets remain central to financial planning.
🤖 What AI-Powered Forecasting Usually Means
“AI forecasting” covers several tools. Some use statistical time-series methods to project a series from its past pattern. Others use machine-learning models that identify relationships among many variables, such as marketing activity, seasonality, pricing, web traffic, weather, or customer attributes.
Generative AI can assist with narrative explanations, model documentation, anomaly summaries, and formula drafting. It should not be confused with the forecasting engine itself: a fluent explanation is not evidence that an underlying prediction is valid.
🧮 The Core Difference: Rules Versus Learned Patterns
A spreadsheet is usually rule-based. The modeler specifies the relationship: perhaps conversion rate rises after a campaign, or raw-material cost follows a contracted price schedule.
An AI model is usually data-driven. It estimates relationships from historical observations. This can reveal patterns people did not encode manually, but it can also learn accidental correlations that do not continue into the future.
🧱 Why Spreadsheet Models Remain Valuable
Spreadsheets are especially strong when a forecast depends on known future events. A signed customer contract, a planned price increase, a lease commencement, or an approved hiring plan can be modeled directly rather than inferred from old data.
They also support controlled “what if” thinking. A finance manager can change one assumption, observe the effect on profit and cash, and discuss the business implication with decision-makers.
⚡ Where AI Can Add Real Forecasting Value
AI can be useful when data is plentiful, frequently updated, and too detailed for manual review. A retailer with many products and locations, for example, may need forecasts at combinations of product, store, day, and channel that would be impractical to maintain by hand.
Machine-learning approaches can also incorporate many potential drivers at once. This may improve forecasts where demand is shaped by interacting factors rather than one stable trend.
🗂️ Data Quality Is the First Constraint
Neither approach can repair unreliable source data by itself. Duplicate customers, inconsistent product codes, delayed invoices, missing returns, and changes in accounting treatment can make a model appear more intelligent than it is.
Before comparing methods, teams should establish whether the historical data represents the process they want to predict. A sales dataset that records bookings in one period and cancellations in another may need adjustment before it becomes a useful demand signal.
🕰️ Historical Data Does Not Automatically Describe the Future
AI forecasting relies heavily on historical patterns. That is reasonable when the underlying process is stable, but it becomes risky after a major shift in prices, competition, regulation, supply availability, or customer behavior.
Spreadsheets face the same uncertainty, but their assumptions may make the break explicit. The best response to a changed environment is often neither blind extrapolation nor intuition alone; it is a revised model with clearly stated scenarios.
🌊 Structural Breaks Can Fool Any Model
A structural break is a lasting change in the system being forecast. Launching a new product line, entering a new market, changing subscription terms, or acquiring another business can all make earlier data less comparable.
An AI model may interpret the old pattern as still relevant. A spreadsheet may carry forward outdated growth rates. In both cases, management judgment is needed to decide which history remains informative and which history should be discounted.
🎯 Accuracy Must Be Tested Against a Baseline
A sophisticated model should not be judged by appearance. It should be compared with simple alternatives, such as last period’s value, the same period last year, or a rolling average. If complexity does not beat a sensible baseline, it may not be worth operating.
Testing should use past periods that were not used to build the model. This is often called backtesting: generate a forecast using only information available at the time, then compare it with what actually occurred.
📏 Different Forecast Errors Matter in Different Ways
Average error can hide costly patterns. A forecast that is sometimes too high and sometimes too low may have a modest average bias while still creating severe inventory or cash problems.
| Question | Why it matters |
|---|---|
| Is the forecast consistently high or low? | Systematic bias can distort budgets and incentives. |
| How large are typical errors? | Shows day-to-day planning usefulness. |
| How large are worst-case errors? | Helps assess liquidity and operational risk. |
| Does performance vary by segment? | A good total may conceal weak product or region forecasts. |
Finance teams should choose measures that match the decision, rather than treating one accuracy statistic as a universal score.
🔍 Explainability Is a Control, Not a Luxury
Decision-makers need to know why a forecast moved. A spreadsheet can usually show the relevant drivers directly. Some AI methods can provide feature importance or driver explanations, though these explanations may be approximate rather than causal.
If a forecast cannot be explained well enough to challenge, approve, and act on, it is poorly suited to a high-stakes financial decision. Explainability supports accountability when results are wrong.
🧾 Audit Trails Matter in Finance
Financial forecasts often feed budgets, lender discussions, board materials, and management reporting. Teams need records of source data, transformations, assumptions, model versions, approvals, and overrides.
A spreadsheet is not automatically auditable—hidden rows, hard-coded figures, and unclear formulas create risk. Likewise, an AI platform needs version control, data lineage, access controls, and retained outputs. Governance is a design choice in either environment.
🧠 Human Judgment Is Still an Input
Forecasting is not a contest between people and machines. Managers may know that a major customer is delaying an order, a competitor has entered a region, or a factory shutdown is planned. Such information may not yet exist in the data.
Judgment should be documented rather than silently inserted. A useful practice is to record the original model forecast, the override, the reason, the owner, and the later outcome. This makes judgment reviewable and improves future learning.
🧪 A Hypothetical Revenue Forecast
Consider a software company forecasting quarterly subscription revenue. Its spreadsheet model starts with active customers, applies known contract renewals, models expected churn by customer tier, and adds pipeline deals weighted by sales stage.
An AI model might analyze payment history, product usage, support activity, sales interactions, and customer characteristics to estimate renewal or expansion likelihood. The AI model may identify early churn signals, while the spreadsheet captures signed renewals and strategic deals. Combining both can be more useful than choosing only one.
💵 Cash Forecasting Requires Special Care
Profit forecasts and cash forecasts are not interchangeable. Cash timing depends on invoicing, customer payment behavior, payroll dates, tax obligations, inventory orders, debt servicing, and supplier terms.
AI may help predict collection timing from customer-level payment history. But scheduled payments and known financing events should normally be modeled explicitly. For near-term liquidity, a transparent driver-based cash forecast is often essential.
🏭 Granularity Can Help or Hurt
AI can forecast thousands of detailed series, but detail is useful only when it supports a decision. Forecasting every minor product-location combination may introduce noise and create a false impression of control.
Conversely, an overly aggregated spreadsheet can hide important shifts. The appropriate level is the lowest level at which managers can act: perhaps customer segment for retention, product family for supply planning, and total cash balance for treasury.
🔗 Correlation Is Not a Business Cause
Machine learning may discover that two variables move together. That does not mean one causes the other. A model may find that sales rise when a particular web metric rises, while both are actually responding to a seasonal campaign.
This matters when teams use forecasts to choose actions. A relationship that predicts well may still be unsafe as a policy rule. Finance leaders should ask whether the driver is plausible, stable, and consistent with operational knowledge.
🧰 Feature Selection Needs Business Discipline
Features are the inputs used by an AI model. More features do not automatically create a better forecast. Some are stale, duplicated, unavailable at forecast time, or influenced by the outcome being predicted.
A dangerous example is data leakage: using information that would not have been known when the forecast was made. Leakage can produce excellent historical test results and disappointing live performance. Clear cutoff dates and realistic test procedures are vital.
📉 Overfitting Makes Models Look Smarter Than They Are
Overfitting occurs when a model learns random quirks of past data instead of repeatable patterns. It may perform impressively on the data used for development and then fail when conditions change.
Simple models often deserve serious consideration because they are harder to overfit and easier to monitor. Complexity should be earned through demonstrated out-of-sample improvement, not added because it sounds advanced.
🔄 Forecasts Need Ongoing Monitoring
A model is not finished at deployment. Input data can change, customer behavior can drift, and business processes can be redesigned. A forecast that worked last year may gradually become unreliable without producing an obvious technical error.
Set a review rhythm that checks forecast error, bias, missing data, unusual driver values, and changes in model use. Define who investigates deterioration and when a model should be recalibrated, replaced, or temporarily overridden.
🛡️ Security and Confidentiality Are Practical Risks
Financial data may include customer information, employee compensation, pricing, bank details, and commercially sensitive plans. Uploading this information to an external AI service without appropriate review can create confidentiality and compliance risks.
Organizations should understand where data is processed, who can access it, how long it is retained, and whether it may be used to improve a provider’s systems. The right controls depend on the organization and applicable obligations.
👥 Skills Change Rather Than Disappear
AI tools can reduce repetitive preparation work, but they increase the value of financial judgment. Professionals still need to understand accounting flows, operating drivers, data definitions, controls, and the limitations of a prediction.
The valuable question is no longer only “Can I build the formula?” It is also “Does this model use the right data, answer the right decision question, and fail in a way we can detect?”
⚖️ When a Spreadsheet Is Usually the Better Choice
A traditional model is often preferable when the forecast is driven by a limited number of known, controllable events; when data history is short; when stakeholders require transparent assumptions; or when the decision is high stakes and the process changes frequently.
- New businesses with little usable historical data.
- Project forecasts based on contracts, milestones, and staffing plans.
- Board cases where scenario assumptions need direct review.
- Short-term cash models built around known receipts and payments.
These are not “less advanced” cases. They are cases where explicit business logic is often the most reliable representation.
🚀 When AI Is Often Worth Testing
AI is worth evaluating when large, clean datasets contain recurring patterns; when forecasts are needed across many similar items; when manual updates are slow; and when there is a measurable operational benefit from improved accuracy or earlier signals.
Good candidates include demand forecasting across many products, expected payment timing across many customers, recurring churn-risk estimation, and anomaly detection in expenses or transactions. Testing should begin with a narrow use case and a defined benchmark.
🤝 Hybrid Forecasting Is Often the Strongest Design
A hybrid process uses each method where it is strongest. AI can generate a statistical baseline, flag anomalies, or estimate behavior at scale. A spreadsheet or planning model can incorporate signed contracts, management decisions, policy constraints, and explicit scenarios.
For example, an organization might use an AI forecast for baseline sales by channel, then adjust it in a controlled driver model for a planned price change and a known product launch. The adjustment should remain visible rather than becoming an unexplained overwrite.
🧭 Build a Sensible Evaluation Process
Teams considering AI forecasting can move carefully without creating a major transformation project. Start with one decision where improved timing or accuracy would matter, then define what “better” means before selecting a tool.
- Document the existing forecast, its users, and its pain points.
- Clean and define the source data, including timing and ownership.
- Create a simple baseline forecast for comparison.
- Backtest candidate methods across relevant past periods.
- Review accuracy, bias, explainability, and operational effort.
- Run a parallel period before relying on the new output.
- Establish approval, override, monitoring, and security controls.
🚫 Common Implementation Mistakes
The most common mistake is buying a tool before defining the forecast problem. A model cannot compensate for unclear ownership, inconsistent data definitions, or a planning process that does not use forecasts to make decisions.
Other mistakes include treating a vendor demonstration as proof of performance, accepting opaque outputs for critical decisions, measuring only average accuracy, and removing human review too early. Each can make automation appear successful until conditions change.
📚 Forecasting Is a Learning Loop
The final actual result is feedback. Teams should compare it with the model prediction and the judgment-adjusted forecast, then ask what drove the gap. Was the issue data timing, an unrealistic assumption, an unexpected event, or a model limitation?
Over time, this review creates institutional learning. It improves definitions, reveals recurring sources of bias, and helps distinguish useful manager insight from habitual optimism or conservatism.
✅ The Reliability Question Has No Single Winner
AI-powered forecasts are not inherently more reliable than traditional spreadsheet models. They can outperform manual approaches when repeatable patterns, quality data, appropriate testing, and strong monitoring are present. They can also fail opaquely when those conditions are absent.
Spreadsheets are not inherently outdated. They are powerful when they represent known business drivers clearly and are maintained with disciplined controls. Their weakness is often manual error, fragile design, or assumptions that are never revisited—not the spreadsheet format itself.
🏁 The Core Principle for Finance Teams
The best forecasting system is the one that improves decisions while remaining proportionate to the problem. It should combine relevant data, explicit assumptions, honest uncertainty, testing against actual results, and accountable human review.
Choose methods based on the forecast’s purpose, not on the novelty of the technology. Use AI to recognize patterns at scale, use driver models to represent planned business actions, and use governance to make both trustworthy.
Reliable forecasting comes from disciplined data, tested methods, transparent judgment, and continuous learning—not from AI or spreadsheets alone. 💰📊🤝