
A distribution manager sees on-time delivery fall for two consecutive weeks. The dashboard shows a red indicator, the operations team adds overtime, and customers begin asking for updates. Yet the finance team still cannot answer the question that matters most: what will this do to profit?
This gap is common. Operational dashboards may track activity in real time, while financial reports explain results weeks later. Both views are useful, but neither is sufficient when they remain disconnected.
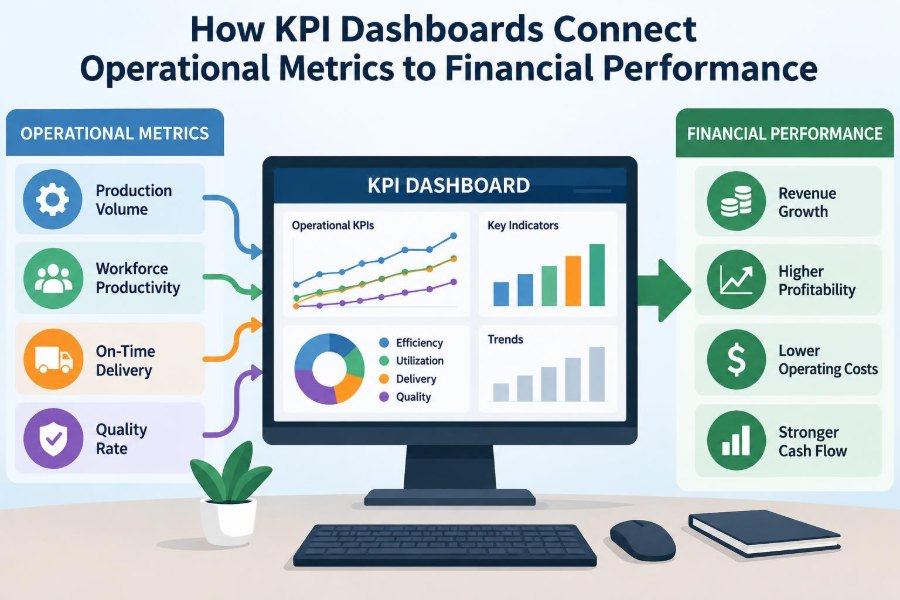
A well-designed KPI dashboard creates a bridge between the daily work of people, systems, and equipment and the financial outcomes reported in the income statement, balance sheet, and cash flow statement. It turns numbers into a chain of cause and effect.
For accounting students, analysts, managers, and business owners, the skill is not simply choosing attractive charts. It is understanding which operational measures genuinely influence revenue, cost, margin, assets, liabilities, and cash. 📈
🧭 1. Start with the connection, not the chart
A key performance indicator, or KPI, is a measure used to assess progress toward an objective. A dashboard is the structured display that helps users review those measures and act on them.
The dashboard becomes financially valuable when every important operational KPI has a credible route to a financial outcome. Faster production, for example, matters only if it improves sales capacity, lowers unit cost, reduces inventory, or creates another measurable benefit.
Start by asking: “If this metric changes, which financial account or financial driver should eventually change?” That question prevents dashboards from becoming collections of interesting but disconnected activity data.
🔗 2. Understand the operating-to-financial value chain
Most businesses follow a basic sequence: acquire resources, perform work, deliver value, invoice customers, collect cash, and reinvest. Operational metrics observe steps in that sequence; financial statements summarize their monetary consequences.
A value chain can be expressed simply:
Operational input → Process performance → Customer outcome → Financial result
For a manufacturer, machine availability may affect production output, which affects order fulfillment, which affects revenue and inventory cost. For a service firm, staff utilization may affect billable hours, which affects revenue, payroll efficiency, and receivables.
🎯 3. Define the decision each KPI should support
A KPI is stronger when it is tied to a recurring decision. “Customer satisfaction” may be important, but a manager needs to know whether the measure helps decide staffing levels, process improvements, account follow-up, pricing, or investment priorities.
For each candidate KPI, document four elements:
- Decision owner: the person accountable for responding.
- Decision cadence: daily, weekly, monthly, or quarterly.
- Action: the practical response if performance changes.
- Financial pathway: the expected effect on revenue, cost, assets, liabilities, or cash.
If no action is likely, the metric may be informative, but it probably does not belong in the primary management dashboard.
💰 4. Begin with the financial statements
Financial performance is ultimately reflected in three connected statements. The income statement shows profitability over a period, the balance sheet shows financial position at a point in time, and the cash flow statement explains cash movements.
Build dashboards backward from these outcomes. Identify the lines that leadership most needs to improve or protect, then find the operational drivers underneath them.
| Financial focus | Possible operational drivers | Management question |
|---|---|---|
| Revenue | Sales conversion, capacity, order fulfillment, retention | Can the business win and deliver profitable demand? |
| Gross margin | Yield, labor efficiency, material waste, discounting | Are sales being produced and delivered efficiently? |
| Working capital | Inventory turns, billing speed, collection cycle, supplier terms | How much cash is tied up in operations? |
| Operating cash flow | Collections, payment timing, purchase planning | Is profit becoming cash? |
🧮 5. Separate leading, lagging, and diagnostic KPIs
Lagging indicators describe outcomes that have already occurred, such as monthly revenue, gross margin, operating profit, or days sales outstanding. They are necessary because they show what the business achieved.
Leading indicators may signal a future result. Qualified pipeline, schedule adherence, first-contact resolution, preventive maintenance completion, and renewal activity can provide earlier warning or opportunity.
Diagnostic indicators help explain why another KPI moved. If gross margin declines, material price variance, scrap rate, overtime hours, and sales discounts may help locate the cause.
A balanced dashboard uses all three. Leading measures alert managers, diagnostic measures guide intervention, and lagging measures confirm the financial result.
🏭 6. Translate production metrics into cost and margin
In production environments, throughput, cycle time, yield, scrap, rework, downtime, and labor hours are not merely engineering measures. They influence the cost of goods sold, inventory valuation, capacity use, and gross margin.
A higher scrap rate can consume more materials and labor to produce the same number of saleable units. Depending on the accounting system and inventory flow, the cost may remain in inventory temporarily before reaching expense through cost of goods sold.
Dashboard users should distinguish between a physical measure, such as kilograms of waste, and its financial translation, such as waste cost per good unit produced. Both are useful, but they answer different questions.
⏱️ 7. Connect time metrics to economic outcomes
Time is often a hidden cost driver. Long cycle times can delay delivery, increase work in process, require extra coordination, and reduce the capacity available for new demand.
However, faster is not automatically better. A shorter handling time that creates errors, customer complaints, or rework may damage margin rather than improve it.
Use paired measures. For example, track order-processing time with order accuracy, or call-handling time with resolution quality. This prevents a local efficiency target from shifting costs elsewhere.
📦 8. Treat inventory as both an operational and financial KPI
Inventory supports customer service and production continuity, but it also ties up cash and carries risks of obsolescence, damage, and storage cost. The balance sheet records inventory as an asset until it is sold or written down.
Useful dashboard measures include inventory turnover, days of inventory on hand, stockout frequency, aged inventory, forecast accuracy, and fill rate. No single measure gives the complete picture.
Reducing inventory can release cash, but aggressive reductions may increase stockouts and lost sales. The right target depends on demand variability, supplier reliability, lead times, and service promises.
🚚 9. Link fulfillment performance to revenue quality
Order fulfillment affects more than customer satisfaction. Late, incomplete, or inaccurate orders can lead to canceled sales, credits, returns, expedited freight, warranty costs, and weaker customer retention.
Operational teams may monitor on-time, in-full delivery. Finance can connect it to credit notes, return rates, freight cost, customer concentration risk, and realized revenue.
Use clear definitions. “On time” based on a promised date, a requested date, or an internally revised date may produce very different results. A dashboard is only as reliable as its measurement rules.
🧑💼 10. Make labor metrics financially meaningful
Labor cost is frequently one of the largest controllable expenses. But headcount alone is a weak performance measure because it says little about workload, quality, output, skill mix, or capacity constraints.
More informative measures may include revenue per employee, units per labor hour, billable utilization, overtime percentage, absence rate, training completion, and error rates. These should be interpreted together, not used as isolated scorecards.
For example, overtime may raise short-term payroll expense, but it can also protect revenue during a demand surge. The dashboard should help management assess the trade-off rather than automatically label overtime as failure.
🛠️ 11. Measure capacity without confusing it with demand
Capacity is the ability to perform work; demand is the work customers want. Financial stress can arise when either exceeds the other for too long.
Excess capacity may create under-absorption of fixed costs, idle labor, or low asset utilization. Insufficient capacity may create missed sales, premium freight, subcontracting, overtime, and declining service quality.
A dashboard should show available capacity, committed capacity, actual utilization, backlog, and the profitability of the work being accepted. This makes operational constraints visible before they become financial surprises.
🧾 12. Follow the path from order to cash
Revenue recognition and cash collection are related but distinct. A business may record revenue when performance obligations are satisfied under its applicable accounting policies, while cash arrives later through the collection process.
The order-to-cash dashboard can include order backlog, shipment or service completion, invoice accuracy, invoice cycle time, disputed invoices, aging of receivables, and collection effectiveness.
Slow billing is an operational problem with a cash consequence. So are incomplete documentation, customer disputes, and poor handoffs between delivery, sales, and accounts receivable.
💧 13. Use working capital metrics to reveal cash tied up
Working capital broadly reflects short-term operating resources and obligations. It is commonly considered through receivables, inventory, payables, and other current items relevant to the business.
Operational decisions influence how long cash remains tied up. Buying too early can increase inventory; billing too late can increase receivables; paying suppliers earlier than necessary can reduce available cash.
Monitor the cycle as a connected system. Improving collections while allowing inventory to grow rapidly may not improve overall operating cash flow.
📉 14. Distinguish profit from cash
Profit measures performance over a period under accounting rules. Cash measures actual inflows and outflows. A profitable company can still experience cash pressure when receivables rise, inventory builds, or capital spending increases.
This is why operational dashboards should not stop at sales and margin. They should include the timing measures that explain whether operations are converting earnings into available cash.
A useful management question is: “What operational events caused cash to move differently from profit this period?” The answer often lies in collection delays, purchasing patterns, stock levels, or payment timing.
📈 15. Build a KPI tree from strategic goal to daily action
A KPI tree shows how high-level objectives break into controllable drivers. It helps people see that their daily work is part of a wider economic system.
For example, a goal to improve operating profit might branch into revenue growth and cost control. Revenue growth could branch into lead conversion, retention, average order value, fulfillment capacity, and service reliability.
Each branch should eventually reach measures that a team can influence. If employees cannot affect a KPI, it may be useful for context but should not be used as their direct performance target.
🧱 16. Define formulas, boundaries, and ownership
Every KPI needs a documented definition. This includes the formula, data source, unit of measure, reporting period, inclusions and exclusions, owner, and refresh frequency.
Consider an on-time delivery rate. Does the numerator count orders, order lines, units, or customer shipments? Are customer-requested date changes excluded? Are partial deliveries treated as successful?
These details are not administrative trivia. They determine whether trends are comparable and whether teams trust the dashboard.
🗂️ 17. Establish a reliable data model
Operational systems, customer relationship tools, timekeeping systems, inventory records, and the general ledger may use different identifiers and timing conventions. Connecting them requires disciplined data modeling.
Common linking fields include customer, product, service line, location, employee group, order number, project, cost center, and accounting period. A consistent chart of accounts and master-data governance make analysis much easier.
When direct linkage is unavailable, use carefully documented allocation or mapping rules. Do not present estimated relationships as if they were exact transaction-level facts.
🕒 18. Match reporting frequency to the process
Some operations require intraday monitoring, such as service queues, machine downtime, website transactions, or logistics exceptions. Financial close, by contrast, often follows a monthly or periodic schedule.
A good dashboard uses different refresh rates without mixing them carelessly. Daily operations data may be provisional, while month-end financial data may include accruals, adjustments, and reconciliations not present earlier.
Label the reporting period and data status clearly. Users should know whether they are seeing real-time activity, a preliminary estimate, or finalized accounting information.
🚦 19. Set targets that encourage sound decisions
Targets give KPIs meaning, but poorly designed targets can encourage gaming. A team measured only on shipping speed may ship incomplete orders. A team measured only on labor efficiency may delay necessary maintenance or quality checks.
Use guardrails: pair a primary target with measures that protect quality, safety, customer outcomes, and long-term value. Consider ranges and trend direction where a single rigid threshold is inappropriate.
Targets should reflect strategic priorities, operating constraints, and historical context. They should be reviewed when the business model, demand pattern, or cost structure changes.
⚖️ 20. Avoid local optimization
Local optimization occurs when one department improves its own metric while harming the wider organization. It is one of the biggest risks in dashboard design.
Procurement may reduce purchase prices by ordering larger quantities, while finance sees inventory rise and operations faces storage issues. Customer service may reduce average call time while repeat calls increase.
Cross-functional dashboards expose these trade-offs. They encourage discussions about total value, not just departmental performance. 🤝
🧪 21. Use variance analysis to move from signal to explanation
A variance is the difference between actual results and a benchmark such as a plan, forecast, prior period, standard, or target. The dashboard should reveal both the variance and the drivers behind it.
For cost analysis, managers may separate effects from volume, price, mix, efficiency, and timing. For revenue analysis, they may examine customer volume, conversion, price realization, product mix, churn, and delivery capacity.
The purpose is not to assign blame. It is to identify which assumptions changed and which operational levers can improve the next period.
🔍 22. Add drill-down paths, not just summary visuals
An executive may need a concise view of revenue, margin, cash, and major risks. A supervisor may need order-level exceptions, staffing detail, queue conditions, or machine-level causes.
Design the dashboard so users can move from a summary KPI to contributing segments: region, product, customer group, location, channel, team, or time period. This is known as drill-down.
Drill-down turns a red indicator into an investigable issue. Without it, users may know that performance changed but not where to begin.
🗣️ 23. Turn dashboard review into a management routine
Dashboards create value through conversations and decisions, not through passive viewing. A regular review meeting should focus on exceptions, drivers, actions, owners, and expected timing.
A practical review sequence is:
- Confirm the financial outcome or risk.
- Identify the operational drivers that changed.
- Test whether the data and definitions are reliable.
- Agree on corrective action, owner, and due date.
- Review the result in the next cycle.
This routine connects measurement with accountability while preserving space for professional judgment.
🛡️ 24. Build controls into dashboard reporting
Dashboards influence decisions, bonuses, forecasts, and resource allocation. Therefore, important measures need controls similar to other management reports.
Useful controls include reconciliations to the general ledger where appropriate, automated data-quality checks, access controls, change logs for formulas, review of unusual movements, and documented approval for manual adjustments.
Control does not mean slowing down every report. It means making the reliability of important information visible and manageable.
🧠 25. Recognize common dashboard mistakes
Many KPI dashboards fail for predictable reasons. They show too many measures, emphasize what is easy to collect, hide definitions, use inconsistent periods, or offer no route from a number to an action.
Frequent warning signs
- Metrics have no stated financial or strategic purpose.
- Green and red colors replace explanation.
- Teams debate data definitions more than business actions.
- Targets reward speed while ignoring quality or cash.
- Financial results and operational measures use incompatible time periods.
- Users receive dashboards but never discuss decisions or follow-up.
Simplification is often an improvement. A smaller set of trusted, actionable measures is more valuable than an impressive screen filled with noise.
🧩 26. Apply the framework across different business models
The operational-financial link exists in every sector, but the key drivers differ. Retailers may focus on traffic, conversion, basket value, availability, returns, and inventory turns. Professional services firms may focus on utilization, realization, project margin, backlog, and collections.
Subscription businesses may monitor acquisition cost, activation, renewal, churn, support demand, and service delivery cost. Healthcare, public services, and nonprofit organizations may also track mission outcomes alongside resource use, capacity, and funding constraints.
The principle remains the same: choose operational measures that explain the organization’s financial sustainability and its ability to deliver its purpose.
🌱 27. The core principle: connect action to economic value
The best KPI dashboard is a management map. It shows how frontline activity affects customer outcomes, how customer outcomes affect financial performance, and where leaders can intervene before a period closes.
Start with the financial result that matters, identify its operational drivers, define each metric carefully, balance speed with quality and cash, and establish a repeatable review process. The dashboard should make trade-offs visible rather than pretend they do not exist.
When operational metrics are connected to financial outcomes, a KPI dashboard becomes more than a reporting tool: it becomes a practical system for making better decisions. 📊💡🚀