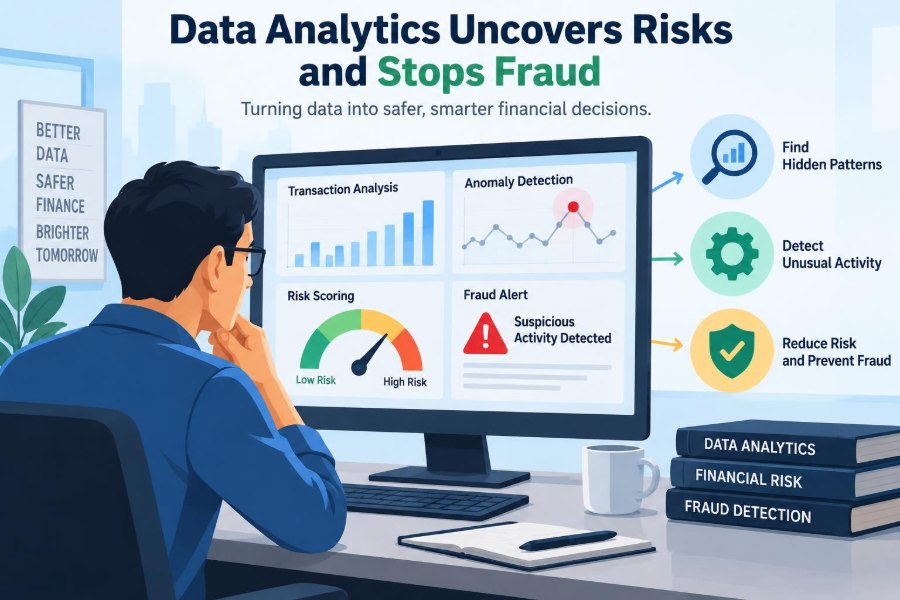

A finance team closes the month and finds a supplier invoice that looks completely ordinary. The amount is reasonable, the supplier exists, and the approver is authorized. Yet one detail is unusual: the invoice arrived just after the supplier’s bank account was changed, and several similar payments are clustered around the same time.
Traditional controls may catch some of these cases, but they often rely on fixed thresholds and periodic review. Modern data analytics adds a different capability: it can connect transactions, behavior, timing, documents, and relationships that would be difficult for one reviewer to examine together.
That matters because financial risk is not limited to obvious fraud. It includes deteriorating credit quality, operational errors, payment diversion, regulatory breaches, unusual trading activity, and weaknesses in internal controls. Better detection can protect cash, reduce false alarms, and focus scarce investigative time where it is most useful.
The most valuable discovery is not that an algorithm can “find fraud.” It is that financial signals become far more informative when organizations combine sound accounting knowledge, good data, thoughtful models, and human judgment.
🔎 From Rules to Patterns
Older monitoring systems commonly use rules: flag a payment above a limit, a journal entry posted at an unusual hour, or a customer transaction from a restricted location. Rules remain essential because they are clear, auditable, and effective for known risks.
Analytics extends this approach by looking for patterns of inconsistency. Rather than asking only whether a payment exceeds $10,000, it can ask whether its amount, timing, approver, supplier, and supporting documents differ materially from that supplier’s normal history.
🧭 Risk Detection Is Broader Than Fraud Detection
Fraud involves intentional deception for gain. Risk analytics also addresses events with no dishonest intent, such as a customer whose payment behavior is weakening or a business unit repeatedly making coding errors.
Keeping these categories separate improves response. A potential error may require training or process redesign; a suspected fraud case may require preserving evidence, restricting access, and involving legal or compliance specialists.
📚 The Data Foundation Comes First
A sophisticated model cannot repair fundamentally unreliable source data. Duplicate vendor records, inconsistent customer identifiers, missing timestamps, and unclear transaction descriptions can produce misleading alerts.
Useful financial risk data may come from general ledgers, accounts payable, bank feeds, expense reports, customer systems, access logs, case-management records, and approved external information. The difficult work is often matching records that refer to the same person, entity, account, or event.
🧹 Data Quality Is a Control, Not Housekeeping
Data cleaning is sometimes treated as a technical chore. In practice, it is part of the control environment. If a supplier’s legal name, tax identifier, and bank account cannot be reliably connected, duplicate-payment and conflict-of-interest checks will be weaker.
Teams should document how fields are standardized, when records are merged, and who can alter master data. Those decisions affect model outputs and should be reviewable just like accounting policies.
🧩 Entity Resolution Connects Fragmented Records
Entity resolution is the process of deciding whether two records represent the same real-world entity. “A. B. Trading Ltd.” and “AB Trading Limited” may be the same supplier despite different spelling.
Exact matching works for stable identifiers such as a validated tax number. Fuzzy matching compares names, addresses, phone numbers, and other attributes when identifiers are incomplete. It is useful, but uncertain matches should be assigned confidence levels rather than treated as fact.
📈 Anomalies Depend on Context
An anomaly is an observation that differs from an expected pattern. It is not proof of fraud. A large payment may be routine for a construction project but highly unusual for a small office supply vendor.
Good anomaly detection compares like with like: similar vendors, comparable business units, normal seasonality, contract terms, and transaction channels. Context reduces both missed risk and needless investigations.
📏 Why Fixed Thresholds Miss Subtle Problems
A single dollar threshold is easy to implement, but it can be bypassed by splitting activity into smaller transactions. It can also create a long queue of legitimate high-value payments.
Relative measures can be more revealing. Examples include an expense amount relative to an employee’s usual claims, a refund relative to a merchant’s sales pattern, or a journal entry relative to the account’s normal month-end activity.
🧠 Machine Learning Learns From Examples
In supervised machine learning, a model learns from historical cases labeled as, for example, confirmed fraud, legitimate activity, or unresolved. It estimates which combinations of features are associated with a target outcome.
This can help prioritize alerts, but labels may be incomplete or biased. Cases investigated first are not necessarily the only risky ones, and past fraud methods may not resemble future methods. A model score should support a decision, not replace it.
🌌 Unsupervised Models Find the Unknown
Unsupervised learning looks for unusual structure without requiring prior labels. It can group transactions into clusters, identify outliers, or detect a new behavioral pattern that has not yet been classified.
This is particularly helpful when confirmed fraud cases are rare. The trade-off is interpretation: an unusual cluster might reflect a new legitimate product, a system migration, or a genuine control failure. Business review remains necessary.
⚖️ Class Imbalance Changes the Meaning of Accuracy
Fraud and serious loss events are often a small fraction of all transactions. In that setting, a system can appear highly accurate simply by labeling nearly everything legitimate.
More meaningful measures include precision, recall, alert volume, investigation capacity, and estimated value protected. Precision asks how many flagged cases were genuinely useful; recall asks how much of the known problematic activity was identified. Neither should be viewed alone.
🚦 Risk Scores Should Prioritize, Not Pronounce Guilt
A risk score is a ranking tool. It may combine signals such as a new bank account, unusual payment timing, an overridden approval, and a mismatch between invoice and purchase order.
Presenting the score as a probability of guilt is a mistake unless the model, data, and calibration justify that interpretation. A safer practice is to describe it as a priority indicator and show the contributing evidence to the reviewer.
🕸️ Network Analytics Reveals Relationships
Many financial schemes are relational. A vendor may share an address, bank account, director, device, or contact detail with an employee, another vendor, or a previously problematic account. Individual transactions can look normal while the network looks unusual.
Network analytics represents entities as points and their connections as lines. It can help investigators see clusters, circular fund movements, or unexpectedly central accounts that deserve closer examination.
🔗 Graphs Make Hidden Connections Visible
A graph is not automatically evidence of wrongdoing. Shared addresses can occur in legitimate group structures, serviced offices, or family-owned businesses. The value lies in identifying connections that warrant verification.
For example, a hypothetical procurement review may find two competing suppliers using the same bank account. That observation should trigger supplier-master-data checks, contract review, and appropriate escalation—not an immediate accusation.
⏱️ Time-Series Analytics Spots Behavioral Drift
Time-series analysis examines observations in sequence. It can identify sudden changes in payment frequency, average claim value, refunds, cash withdrawals, or customer delinquency.
Seasonality matters. Retail activity around holidays and quarterly purchasing near budget deadlines can be legitimate. Baselines should account for recurring cycles before a change is considered suspicious.
🔄 Streaming Analytics Shortens the Response Window
Batch monitoring reviews transactions after they are posted, perhaps daily or monthly. Streaming analytics evaluates events as they arrive, allowing organizations to pause, challenge, or route a transaction for review before settlement where their processes permit.
Real-time action has costs. An overly aggressive block can interrupt payroll, supplier relationships, or customer service. Risk appetite should determine which alerts merely inform, which require additional authentication, and which justify a temporary hold.
📝 Text Analytics Unlocks Unstructured Evidence
Invoices, emails, expense descriptions, contracts, and case notes contain information that does not fit neatly into ledger columns. Natural language processing can extract dates, names, payment terms, invoice numbers, and recurring phrases from text.
Text signals are especially useful when combined with transaction data. An invoice description resembling a purchase order does not prove a valid delivery, but discrepancies between documents can guide a reviewer to the right questions.
📄 Document Analytics Tests Consistency
Document analytics can compare fields across invoices, purchase orders, goods-received records, and payment requests. It may surface repeated invoice numbers, changed banking details, inconsistent tax calculations, or an approval that appears after a service date.
Scanned documents and extraction tools can make errors, particularly with poor image quality or unusual layouts. Material exceptions should be checked against the original record before decisions are made.
🧾 Journal Entries Carry Useful Signals
General ledger entries are a rich source of control information because they record adjustments, accruals, reclassifications, and management estimates. Risk indicators can include unusual manual entries, entries posted near period close, or entries with vague descriptions.
These indicators are not inherently improper. Legitimate closing work is often concentrated near reporting deadlines. The strongest reviews compare entries with user roles, approval history, supporting evidence, and the account’s normal activity.
💳 Payment Fraud Requires Layered Signals
For payment activity, one signal is rarely sufficient. A new payee alone may be legitimate; a new payee combined with a changed beneficiary account, urgent wording, a bypassed approval, and a user logging in from an unfamiliar environment is more concerning.
- Identity signals: account changes, device patterns, or authentication events.
- Transaction signals: amount, recipient, frequency, location, and timing.
- Process signals: exceptions, overrides, missing documents, and approval sequence.
Layering signals helps distinguish a routine exception from a pattern that merits immediate review.
🏦 Credit Risk Benefits From Early Warning Signals
Credit risk analytics looks for changes that may affect a borrower’s ability or willingness to repay. Internal payment history, covenant information, utilization patterns, sector conditions, and financial statement trends can all contribute to monitoring.
Models cannot eliminate uncertainty about the future. A late payment may result from an administrative dispute rather than financial distress. Credit teams need clear escalation criteria and qualitative information from relationship managers.
🪪 Identity Fraud Is Often an Onboarding Problem
Some fraud begins before the first transaction, when a false or manipulated identity is used to open an account, create a supplier, or access a service. Analytics can compare identity attributes, document metadata, device behavior, and application patterns.
Controls must be proportionate and lawful. Identity checks can create friction for legitimate customers and may affect groups differently if source data or assumptions are poor. Monitoring outcomes is part of responsible design.
🧑⚖️ Explainability Supports Defensible Decisions
When an analyst asks why a transaction was flagged, “the model said so” is not enough. Explainability identifies the main factors influencing an alert, such as an unusual beneficiary relationship or a sharp departure from prior behavior.
Clear explanations help investigators test a signal, managers challenge a decision, and auditors understand the process. They are especially important when a score influences customer treatment, employee review, or regulatory reporting.
🔐 Privacy and Access Boundaries Matter
Risk analytics can bring together sensitive financial, personal, and behavioral data. More data is not automatically better. Organizations should define a legitimate purpose, limit access, retain information appropriately, and protect records throughout their lifecycle.
Local privacy, employment, banking, and data-protection requirements vary. Legal, compliance, security, and data-governance teams should be involved before new data sources or monitoring uses are introduced.
⚠️ Bias Can Enter Through Data and Process
Bias may enter through historical labels, uneven investigation practices, proxy variables, or a model’s deployment rules. If past cases received more scrutiny in one segment, the resulting labels may reflect inspection patterns as well as actual risk.
Testing should examine error patterns across relevant groups where lawful and appropriate, as well as differences in service outcomes. Fairness is not a one-time test; data, behavior, and operating conditions change.
🧪 Model Validation Is Continuous Work
A model that performed well during development may weaken when transaction volumes, customer behavior, products, or fraud methods change. This decline is often called model drift.
Validation should include data checks, performance monitoring, challenge by independent reviewers, version control, and documented thresholds for recalibration or retirement. A simple, stable rule may be preferable to a complex model that cannot be maintained responsibly.
👥 Human Investigators Close the Loop
Investigators add context that models lack: a supplier dispute, a known system outage, a credible explanation from a business owner, or evidence that a document has been altered. Their decisions also create feedback that can improve future detection.
Case-management workflows should capture why an alert was closed, escalated, or confirmed. Without consistent outcomes and clear categories, teams cannot reliably learn which signals are useful.
🧭 Alert Design Determines Operational Value
A technically strong model can still fail operationally if it floods a team with low-value alerts. Alert design should specify the owner, evidence shown, required response time, escalation path, and feedback fields.
| Alert characteristic | Useful operational response |
|---|---|
| Low risk, easily explained | Log, monitor, or request automated confirmation |
| Moderate risk with clear evidence | Assign to an analyst with a defined review checklist |
| High risk and time-sensitive | Escalate promptly under approved hold or intervention procedures |
The right design reflects available staff, customer impact, financial exposure, and legal obligations—not just model scores.
🛠️ A Practical Starting Path
Organizations do not need to begin with an advanced artificial intelligence program. A focused use case with accessible data and a measurable process weakness is often more valuable than a broad but vague initiative.
- Define the decision to improve, such as reviewing duplicate payments or risky manual journals.
- Map the process, systems, controls, owners, and likely failure points.
- Establish a baseline using rules and descriptive analysis.
- Add analytical signals, test them with reviewers, and measure workload and outcomes.
- Document governance, then scale only where the process is working.
🚧 Common Implementation Mistakes
One common mistake is treating a dashboard as a control. Visualization can reveal trends, but a control also needs an owner, a response, evidence of performance, and follow-up when an exception occurs.
Other frequent problems include training on unreliable labels, ignoring process changes, failing to involve investigators early, and measuring success only by the number of alerts generated. More alerts can mean more noise.
📊 Accountants Translate Signals Into Decisions
Accounting professionals understand materiality, transaction flows, business purpose, evidence quality, and the difference between an estimate and a recorded fact. Those skills are central to interpreting analytical results.
The accountant’s role is not to become a full-time data scientist. It is to ask disciplined questions: Does this signal make economic sense? What control should have prevented it? What evidence would change our conclusion? Who must act?
🌱 The Core Principle: Better Decisions, Not Automated Suspicion
The most durable advances combine analytics with governance and professional skepticism. Rules capture known concerns, models identify patterns and priorities, and people evaluate evidence in context.
Detection improves when data is reliable, assumptions are visible, decisions are explainable, and feedback reaches the people maintaining the process. Technology is most valuable when it makes financial controls more timely, targeted, and accountable.
Financial risk and fraud analytics work best when they help informed people investigate the right questions at the right time—not when they claim to replace judgment. That is the practical discovery behind the tools changing financial oversight. 💰🔍📊